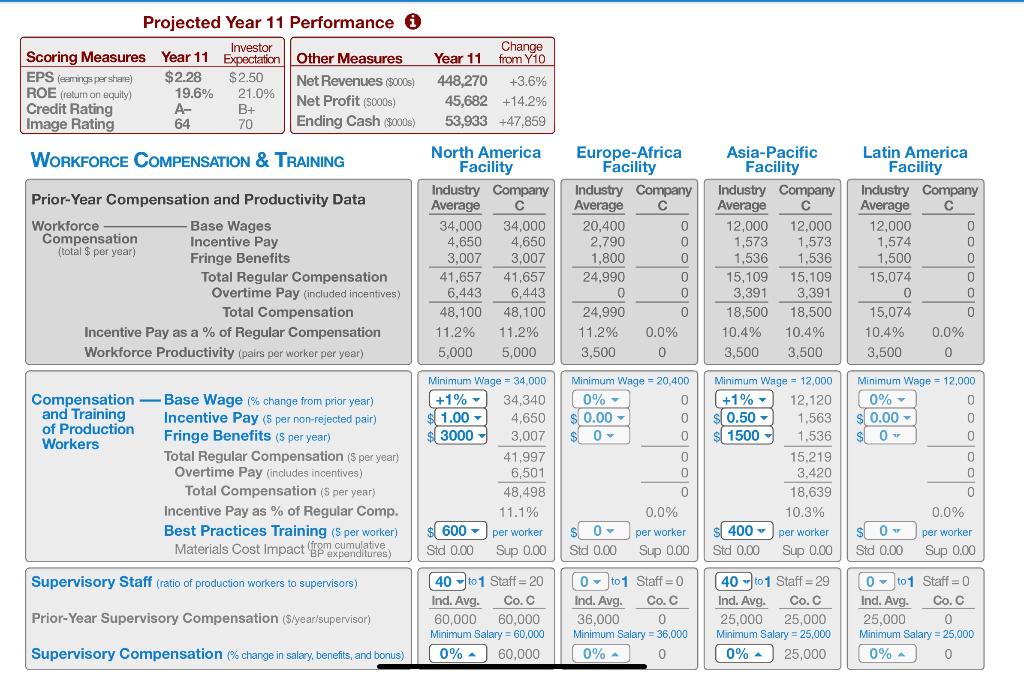
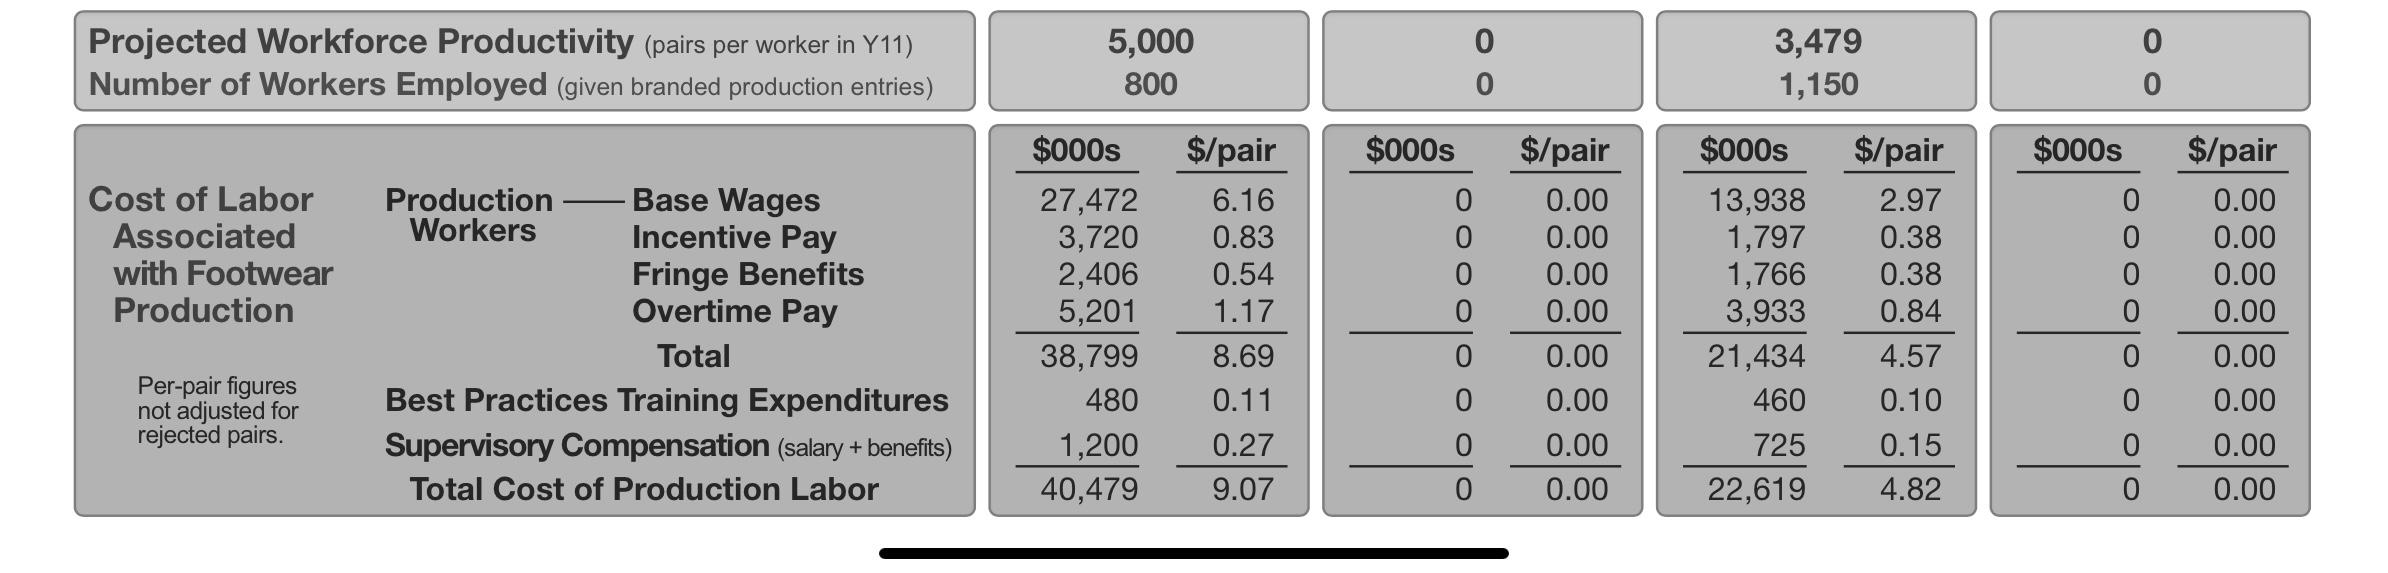
Projected Year 11 Performance _Investor Scoring Measures Year 11 Expectation Other Measures EPS (amingsperstare) $2.28 $2.50 Net Revenues (9000) ROE return on equity) 19.6% 21.0% Net Profit (5000s) Credit Rating A- B+ Image Rating 64 70 Ending Cash (90008) Year 11 fo 448,270 +3.6% 45,682 +14.2% 53,933 +47,859 WORKFORCE COMPENSATION & TRAINING 4,650 Prior-Year Compensation and Productivity Data Workforce Base Wages Compensation Incentive Pay (total $ per year) Fringe Benefits Total Regular Compensation Overtime Pay (included incentives) Total Compensation Incentive Pay as a % of Regular Compensation Workforce Productivity (pairs per worker per year) North America Facility Industry Company Average 34,000 34,000 4,650 3,007 3,007 41.657 41,657 6,443 6,443 48,100 48,100 11.2% 11.2% 5,000 5,000 Europe-Africa Facility Industry Company Average 20,400 0 2,790 0 1,800 0 24,990 0 0 24,990 0 11.2% 0.0% 3,500 0 Asia-Pacific Facility Industry Company Average 12,000 12,000 1,573 1,573 1,536 1,536 15,109 15.109 3,391 3,391 18,500 18,500 10.4% 10.4% 3,500 3,500 Latin America Facility Industry Company Average 12,000 0 1,574 0 1,500 0 15,074 0 0 15,074 0 10.4% 0.0% 3,500 0 Compensation and Training of Production Workers Minimum Wage = 20,400 0% 0 $ 0.00 0 0 0 Minimum Wage = 12,000 0% 0 $ 0.00 0 Ov 0 Base Wage (% change from prior year) Incentive Pay (s per non-rejected pair) Fringe Benefits (5 per year) Total Regular Compensation (S per year) Overtime Pay (includes incentives) Total Compensation (5 per year) Incentive Pay as % of Regular Comp. Best Practices Training (Sper worker) Materials Cost Impact on cumulative Minimum Wage 34.000 +1% 34,340 $11.00 4,650 $ 3000 3,007 41,997 6,501 48,498 11.1% $ 600 per worker Std 0.00 Sup 0.00 0 0 Minimum Wage = 12,000 +1% 12,120 0.50 - 1,563 1500 1,536 15,219 3,420 18,639 10.3% 400 per worker Std 0.00 Sup 0.00 0 0 0 0 0.0% per worker Sup 0.00 0.0% per worker Sup 0.00 0 Std 0.00 OY Std 0.00 Supervisory Staff (ratio of production workers to supervisors) Prior-Year Supervisory Compensation (Styear'supervisor) 40 to1 Staff = 20 Ind. Avg. Co. 60,000 60,000 Minimum Salary = 60,000 0% 60,000 0 to 1 Staff=0 Ind. Avg. Co. 36,000 0 Minimum Salary = 36,000 0% 0 40 01 Staff=29 Ind. Avg. Co. 25,000 25,000 Minimum Salary = 25,000 25,000 0 - 01 Staff = 0 Ind. Avg. Co. 25,000 0 Minimum Salary = 25,000 0 Supervisory Compensation % change in salary, benefits, and bonus) 0% 0% Projected Workforce Productivity (pairs per worker in Y11) Number of Workers Employed (given branded production entries) 5,000 800 0 0 3,479 1,150 0 0 $000s $000s Cost of Labor Associated with Footwear Production $000s 27,472 3,720 2,406 5,201 38,799 $/pair 6.16 0.83 0.54 1.17 8.69 0.11 0.27 9.07 Production Base Wages Workers Incentive Pay Fringe Benefits Overtime Pay Total Best Practices Training Expenditures Supervisory Compensation (salary + benefits) Total Cost of Production Labor 0 0 0 0 $/pair 0.00 0.00 0.00 0.00 0.00 0.00 0.00 0.00 $000s 13,938 1,797 1,766 3,933 21,434 460 725 22,619 $/pair 2.97 0.38 0.38 0.84 4.57 0.10 0.15 4.82 0 0 0 0 $/pair 0.00 0.00 0.00 0.00 0.00 0.00 0.00 0.00 Per-pair figures not adjusted for rejected pairs. 0 0 480 0 0 0 1,200 40,479 0 0 0 Projected Year 11 Performance _Investor Scoring Measures Year 11 Expectation Other Measures EPS (amingsperstare) $2.28 $2.50 Net Revenues (9000) ROE return on equity) 19.6% 21.0% Net Profit (5000s) Credit Rating A- B+ Image Rating 64 70 Ending Cash (90008) Year 11 fo 448,270 +3.6% 45,682 +14.2% 53,933 +47,859 WORKFORCE COMPENSATION & TRAINING 4,650 Prior-Year Compensation and Productivity Data Workforce Base Wages Compensation Incentive Pay (total $ per year) Fringe Benefits Total Regular Compensation Overtime Pay (included incentives) Total Compensation Incentive Pay as a % of Regular Compensation Workforce Productivity (pairs per worker per year) North America Facility Industry Company Average 34,000 34,000 4,650 3,007 3,007 41.657 41,657 6,443 6,443 48,100 48,100 11.2% 11.2% 5,000 5,000 Europe-Africa Facility Industry Company Average 20,400 0 2,790 0 1,800 0 24,990 0 0 24,990 0 11.2% 0.0% 3,500 0 Asia-Pacific Facility Industry Company Average 12,000 12,000 1,573 1,573 1,536 1,536 15,109 15.109 3,391 3,391 18,500 18,500 10.4% 10.4% 3,500 3,500 Latin America Facility Industry Company Average 12,000 0 1,574 0 1,500 0 15,074 0 0 15,074 0 10.4% 0.0% 3,500 0 Compensation and Training of Production Workers Minimum Wage = 20,400 0% 0 $ 0.00 0 0 0 Minimum Wage = 12,000 0% 0 $ 0.00 0 Ov 0 Base Wage (% change from prior year) Incentive Pay (s per non-rejected pair) Fringe Benefits (5 per year) Total Regular Compensation (S per year) Overtime Pay (includes incentives) Total Compensation (5 per year) Incentive Pay as % of Regular Comp. Best Practices Training (Sper worker) Materials Cost Impact on cumulative Minimum Wage 34.000 +1% 34,340 $11.00 4,650 $ 3000 3,007 41,997 6,501 48,498 11.1% $ 600 per worker Std 0.00 Sup 0.00 0 0 Minimum Wage = 12,000 +1% 12,120 0.50 - 1,563 1500 1,536 15,219 3,420 18,639 10.3% 400 per worker Std 0.00 Sup 0.00 0 0 0 0 0.0% per worker Sup 0.00 0.0% per worker Sup 0.00 0 Std 0.00 OY Std 0.00 Supervisory Staff (ratio of production workers to supervisors) Prior-Year Supervisory Compensation (Styear'supervisor) 40 to1 Staff = 20 Ind. Avg. Co. 60,000 60,000 Minimum Salary = 60,000 0% 60,000 0 to 1 Staff=0 Ind. Avg. Co. 36,000 0 Minimum Salary = 36,000 0% 0 40 01 Staff=29 Ind. Avg. Co. 25,000 25,000 Minimum Salary = 25,000 25,000 0 - 01 Staff = 0 Ind. Avg. Co. 25,000 0 Minimum Salary = 25,000 0 Supervisory Compensation % change in salary, benefits, and bonus) 0% 0% Projected Workforce Productivity (pairs per worker in Y11) Number of Workers Employed (given branded production entries) 5,000 800 0 0 3,479 1,150 0 0 $000s $000s Cost of Labor Associated with Footwear Production $000s 27,472 3,720 2,406 5,201 38,799 $/pair 6.16 0.83 0.54 1.17 8.69 0.11 0.27 9.07 Production Base Wages Workers Incentive Pay Fringe Benefits Overtime Pay Total Best Practices Training Expenditures Supervisory Compensation (salary + benefits) Total Cost of Production Labor 0 0 0 0 $/pair 0.00 0.00 0.00 0.00 0.00 0.00 0.00 0.00 $000s 13,938 1,797 1,766 3,933 21,434 460 725 22,619 $/pair 2.97 0.38 0.38 0.84 4.57 0.10 0.15 4.82 0 0 0 0 $/pair 0.00 0.00 0.00 0.00 0.00 0.00 0.00 0.00 Per-pair figures not adjusted for rejected pairs. 0 0 480 0 0 0 1,200 40,479 0 0 0