

Answered step by step
Verified Expert Solution
Question
1 Approved Answer
Provide a declining margin version of the NPV analysis, using the Exhibit 7 values and forecasting cash-flows thru 2023, include the terminal value in 2023.
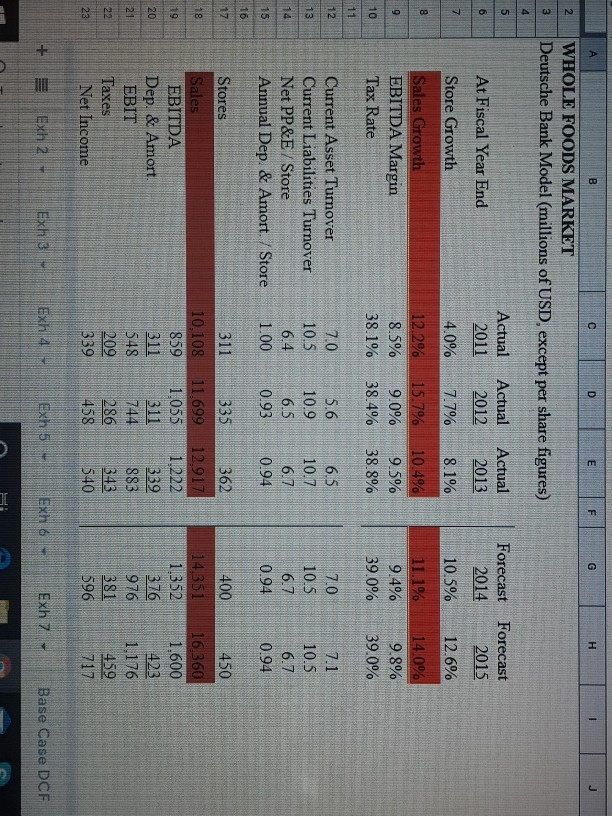
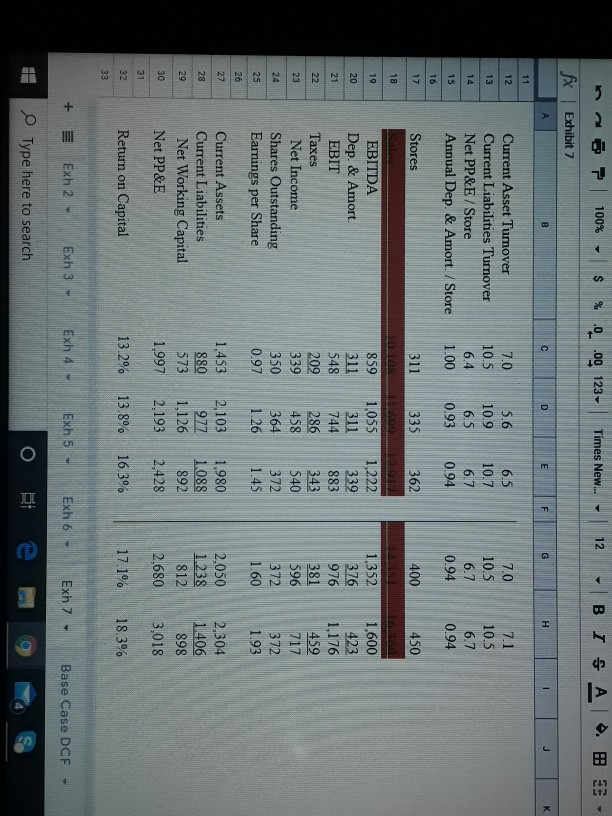
Provide a declining margin version of the NPV analysis, using the Exhibit 7 values and forecasting cash-flows thru 2023, include the terminal value in 2023. Comment on your results. The EBITDA margin declines by 0.5% each year. In the terminal year, the EBITDA margin is estimated at 4.9%, a level that is consistent with the EBITDA margins of conventional grocers. For the steady state growth rate use 3.4%, the real growth rate of 2% plus a rate of expected long-term inflation of 1.4% based on the prevailing 30-year government bond yield. In addition you can adjust the model assumptions to better reflect your vision of the Whole Foods outlook. Be sure to state what you modified and why. DEFGH WHOLE FOODS MARKET Deutsche Bank Model (millions of USD, except per share figures) 3 5 6 Actual 2011 4.0% Actual 2012 7.7% Actual 2013 8.1% At Fiscal Year End Store Growth Sales Growth EBITDA Margin Tax Rate Forecast Forecast 2014 2015 10.5% 12.6% 11.1% 14.0% 9.4% 9.8% 39.0% 39.0% 12.2% 8.5% 38.1% 15.7% 9.0% 38.4% 10.4% 9.5% 38.8% 7.0 Current Asset Turnover Current Liabilities Turnover Net PP&E / Store Annual Dep. & Amort. Store 7. 05. 66.5 10.5 10.9 10.7 6.4 6.5 6.7 1.00 0.93 0.94 10.5 6.7 0.94 7.1 10.5 6.7 0.94 16 362 Stores Sales EBITDA Dep. & Amort EBIT Taxes Net Income 311335 10.108 11,699 859 1.055 311 311 548 744 286 339 458 12.917 1.222 339 883 400 14.351 1,352 3.76 976. 381 450 16,360 1.600 423 1.176 459 717 209 346 540 596 + E Exh 2 - Exh 3 14 Exh 5 Exh Exh 7 Base Case DCF| m fx e Exhibit 7 100% - $ % 4 0 123, Times New... - 12 - BISA - B D E F G H JK 7.1 Current Asset Turnover Current Liabilities Turnover Net PP&E / Store Annual Dep. & Amort / Store 7.0 10.5 6.4 1.00 5.6 10.9 6.5 0.93 6.5 10.7 6.7 0.94 7.0 10.5 6.7 0.94 10.5 6.7 0.94 Stores 400 450 1,600 339 EBITDA Dep. & Amort. EBIT Taxes Net Income Shares Outstanding Earnings per Share 311 335 362 go 859 1,055 1222 311 311 548 744 883 343 339 458 540 350 364 372 0.97 1.26 1.45 1,352 376 976 381 596 423 1,176 459 717 209 286 372 372 1.60 193 Current Assets Current Liabilities Net Working Capital Net PP&E 1.453 880 573 1,997 2,103 977 1.126 2,193 1.980 1.088 892 2,428 2,050 1.238 812 2.680 2,304 1.406 898 3.018 Return on Capital 13.2% 13.8% 16.3% 17.1% 18.3% + Exh 2 Exh 3 - Exh 4 Exh 5 - Exh 6- Exh7 - Base Case DCF - Type here to search o Bieg Provide a declining margin version of the NPV analysis, using the Exhibit 7 values and forecasting cash-flows thru 2023, include the terminal value in 2023. Comment on your results. The EBITDA margin declines by 0.5% each year. In the terminal year, the EBITDA margin is estimated at 4.9%, a level that is consistent with the EBITDA margins of conventional grocers. For the steady state growth rate use 3.4%, the real growth rate of 2% plus a rate of expected long-term inflation of 1.4% based on the prevailing 30-year government bond yield. In addition you can adjust the model assumptions to better reflect your vision of the Whole Foods outlook. Be sure to state what you modified and why. DEFGH WHOLE FOODS MARKET Deutsche Bank Model (millions of USD, except per share figures) 3 5 6 Actual 2011 4.0% Actual 2012 7.7% Actual 2013 8.1% At Fiscal Year End Store Growth Sales Growth EBITDA Margin Tax Rate Forecast Forecast 2014 2015 10.5% 12.6% 11.1% 14.0% 9.4% 9.8% 39.0% 39.0% 12.2% 8.5% 38.1% 15.7% 9.0% 38.4% 10.4% 9.5% 38.8% 7.0 Current Asset Turnover Current Liabilities Turnover Net PP&E / Store Annual Dep. & Amort. Store 7. 05. 66.5 10.5 10.9 10.7 6.4 6.5 6.7 1.00 0.93 0.94 10.5 6.7 0.94 7.1 10.5 6.7 0.94 16 362 Stores Sales EBITDA Dep. & Amort EBIT Taxes Net Income 311335 10.108 11,699 859 1.055 311 311 548 744 286 339 458 12.917 1.222 339 883 400 14.351 1,352 3.76 976. 381 450 16,360 1.600 423 1.176 459 717 209 346 540 596 + E Exh 2 - Exh 3 14 Exh 5 Exh Exh 7 Base Case DCF| m fx e Exhibit 7 100% - $ % 4 0 123, Times New... - 12 - BISA - B D E F G H JK 7.1 Current Asset Turnover Current Liabilities Turnover Net PP&E / Store Annual Dep. & Amort / Store 7.0 10.5 6.4 1.00 5.6 10.9 6.5 0.93 6.5 10.7 6.7 0.94 7.0 10.5 6.7 0.94 10.5 6.7 0.94 Stores 400 450 1,600 339 EBITDA Dep. & Amort. EBIT Taxes Net Income Shares Outstanding Earnings per Share 311 335 362 go 859 1,055 1222 311 311 548 744 883 343 339 458 540 350 364 372 0.97 1.26 1.45 1,352 376 976 381 596 423 1,176 459 717 209 286 372 372 1.60 193 Current Assets Current Liabilities Net Working Capital Net PP&E 1.453 880 573 1,997 2,103 977 1.126 2,193 1.980 1.088 892 2,428 2,050 1.238 812 2.680 2,304 1.406 898 3.018 Return on Capital 13.2% 13.8% 16.3% 17.1% 18.3% + Exh 2 Exh 3 - Exh 4 Exh 5 - Exh 6- Exh7 - Base Case DCF - Type here to search o Bieg
Step by Step Solution
There are 3 Steps involved in it
Step: 1

Get Instant Access to Expert-Tailored Solutions
See step-by-step solutions with expert insights and AI powered tools for academic success
Step: 2

Step: 3
Ace Your Homework with AI
Get the answers you need in no time with our AI-driven, step-by-step assistance
Get Started
Intermediate Accounting
Authors: kieso, weygandt and warfield.
14th Edition
9780470587232, 470587288, 470587237, 978-0470587287