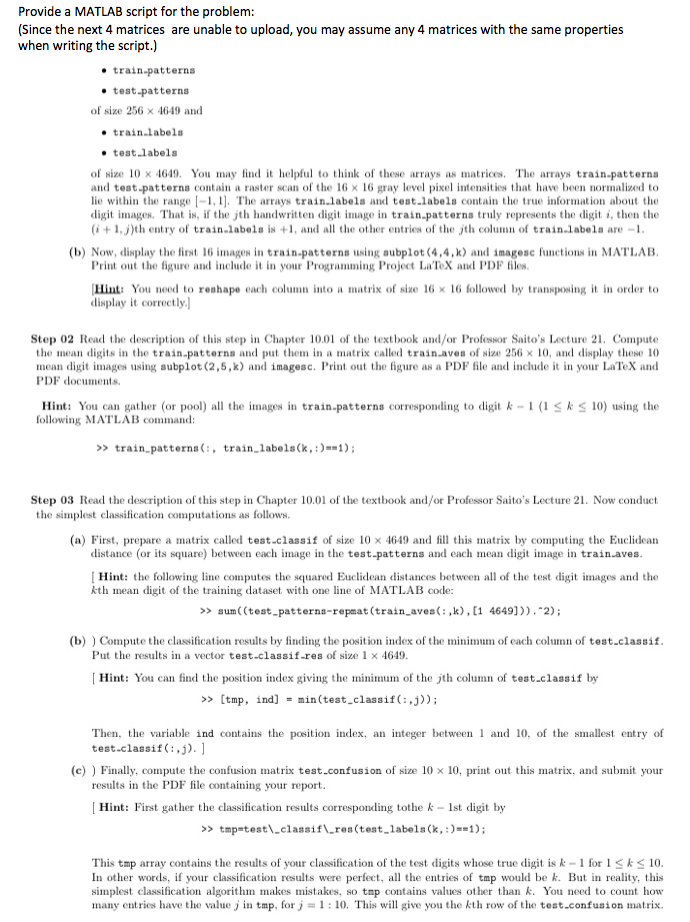
Provide a MATLAB script for the problem: Since the next 4 matrices are unable to upload, you may assume any 4 matrices with the same properties when writing the script.) etrain-patterns test-patterna of size 256 x 4649 and e train labela test.labels of size 10 4649 You may find it helpful to think of these arrays as matrices. The arrays train-patterns and test-patterna contain a raster scan of the 16 x 16 gray level pixel intensities that have been normalized to lie within the range |-1,1]. The arrays train.1abels and test.labela contain the true information about the digit images. That is, if the jth handwritten digit image in train-patterns truly represents the digit i, then the i +1,j)th entry of train labela is +1, and all the other entries of the jth column of train labela are -1 (b) Now, display the first 16 images in train-patternusing aubplot (4,4,k) and imageac functions in MATLAB Print out the figure and include it in your Programming Project La Tex and PDF files Hint: You need to reahape each column into a matrix of size 16 x 16 followed by transposing display it correctly order to Step 02 Read the description of this step in Chapter 10.01 of the textbook and/or Professor Saito's Lecture 21. Compute the mean digits in the train-patterns and put them in a matrix called train.aves of size 256 x 10, and display these 10 mean digit images using subplot (2,5,k) and imagesc. Print out the figure as a PDF file and include it in your LaTeX and PDF documents Hint: You can gather (or pool) all the images in train-patterns corresponding to digit k- following MATLABcomnd: (1Sk10) using the >train,pattern, train labels(k,1) Step 03 Read the description of this step in Chapter 10.01 of the textbook and/or Professor Saito's Lecture 21. Now conduct the simplest classification computations as follows. (a) First, prepare a matrix called test-classif of size 10 x 4649 and this matrix by computing the Euclidean distance (or its square) between each image in the test-patterns and each mean digit image in train.aves Hint: the following line computes the sqaed Euclidean distances between all of the test digit images and the kth mean digit of the training dataset with one line of MATLAB code: >aum((test patterns-repmat (train aves(: k), [1 4649]))."2) (b)) Compute the classification results by finding the position index of the minium of each column of test classif Put the results in a vector test-classif-res of size 1 x 4649 Hint: You can find the position index giving the minimum of the jth column of test.classif by >> [tmp, ind] min(test_classif,j)); Then, the variable ind contains the position index, an integer between1 and 10, of the smallest entry of test-classif(..j). ] (c) ) Finally, compute the confusion matrix test confusion of size 10 10, print out this matrix. and submit your results in the PDF file containing your report Hint: First gather the classification results corresponding tothe k-1st digit by >> tmp-test classiftres(test labels(k, :--1) This tmp array contains the results of your classification of the test digits whose true digit is -1 for 1Sk 10 In other words, if your classification results were perfect, all the entries of tmp would be k. But in reality, this simplest classification algorithm makes mistakes, so tmp contains values other than k. You need to count how many entries have the value j in tmp, for j1:10. This will give you the kth row of the test.confuaion matrix Provide a MATLAB script for the problem: Since the next 4 matrices are unable to upload, you may assume any 4 matrices with the same properties when writing the script.) etrain-patterns test-patterna of size 256 x 4649 and e train labela test.labels of size 10 4649 You may find it helpful to think of these arrays as matrices. The arrays train-patterns and test-patterna contain a raster scan of the 16 x 16 gray level pixel intensities that have been normalized to lie within the range |-1,1]. The arrays train.1abels and test.labela contain the true information about the digit images. That is, if the jth handwritten digit image in train-patterns truly represents the digit i, then the i +1,j)th entry of train labela is +1, and all the other entries of the jth column of train labela are -1 (b) Now, display the first 16 images in train-patternusing aubplot (4,4,k) and imageac functions in MATLAB Print out the figure and include it in your Programming Project La Tex and PDF files Hint: You need to reahape each column into a matrix of size 16 x 16 followed by transposing display it correctly order to Step 02 Read the description of this step in Chapter 10.01 of the textbook and/or Professor Saito's Lecture 21. Compute the mean digits in the train-patterns and put them in a matrix called train.aves of size 256 x 10, and display these 10 mean digit images using subplot (2,5,k) and imagesc. Print out the figure as a PDF file and include it in your LaTeX and PDF documents Hint: You can gather (or pool) all the images in train-patterns corresponding to digit k- following MATLABcomnd: (1Sk10) using the >train,pattern, train labels(k,1) Step 03 Read the description of this step in Chapter 10.01 of the textbook and/or Professor Saito's Lecture 21. Now conduct the simplest classification computations as follows. (a) First, prepare a matrix called test-classif of size 10 x 4649 and this matrix by computing the Euclidean distance (or its square) between each image in the test-patterns and each mean digit image in train.aves Hint: the following line computes the sqaed Euclidean distances between all of the test digit images and the kth mean digit of the training dataset with one line of MATLAB code: >aum((test patterns-repmat (train aves(: k), [1 4649]))."2) (b)) Compute the classification results by finding the position index of the minium of each column of test classif Put the results in a vector test-classif-res of size 1 x 4649 Hint: You can find the position index giving the minimum of the jth column of test.classif by >> [tmp, ind] min(test_classif,j)); Then, the variable ind contains the position index, an integer between1 and 10, of the smallest entry of test-classif(..j). ] (c) ) Finally, compute the confusion matrix test confusion of size 10 10, print out this matrix. and submit your results in the PDF file containing your report Hint: First gather the classification results corresponding tothe k-1st digit by >> tmp-test classiftres(test labels(k, :--1) This tmp array contains the results of your classification of the test digits whose true digit is -1 for 1Sk 10 In other words, if your classification results were perfect, all the entries of tmp would be k. But in reality, this simplest classification algorithm makes mistakes, so tmp contains values other than k. You need to count how many entries have the value j in tmp, for j1:10. This will give you the kth row of the test.confuaion matrix