Answered step by step
Verified Expert Solution
Question
1 Approved Answer
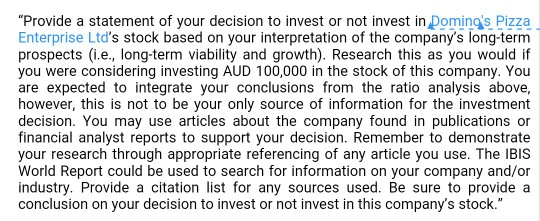
Financial ratio-average below: Provide a statement of your decision to invest or not invest in Domino's Pizza Enterprise Ltd's stock based on your interpretation of
Financial ratio-average below:
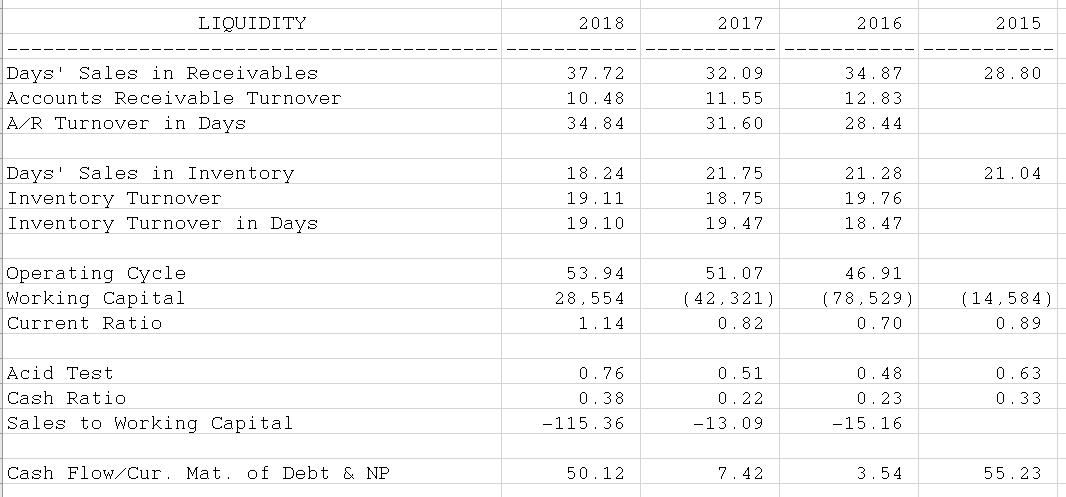

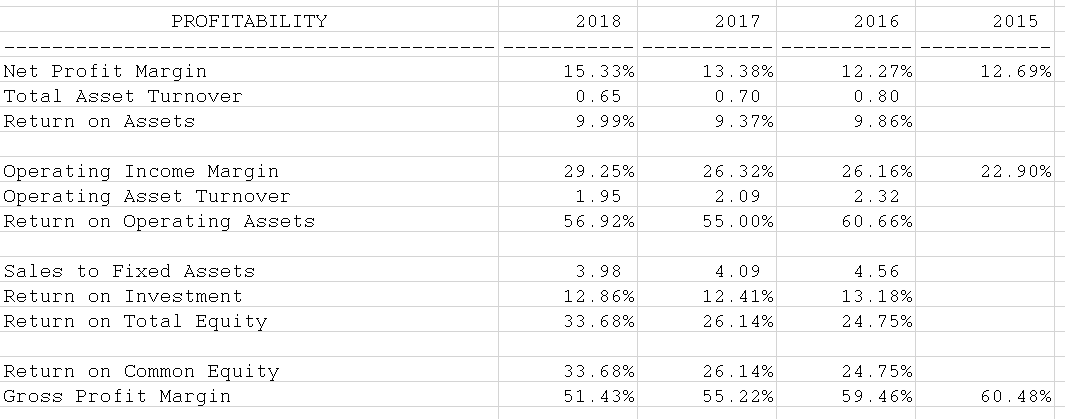
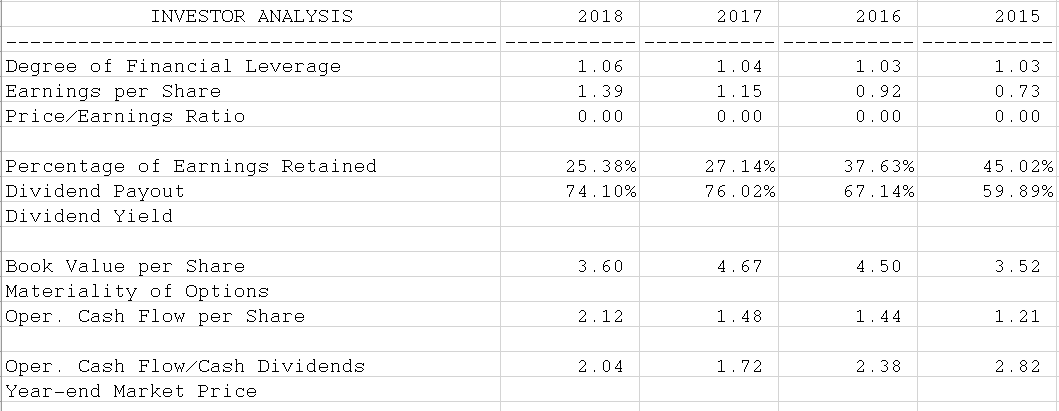
"Provide a statement of your decision to invest or not invest in Domino's Pizza Enterprise Ltd's stock based on your interpretation of the company's long-term prospects (i.e., long-term viability and growth). Research this as you would if you were considering investing AUD 100,000 in the stock of this company. You are expected to integrate your conclusions from the ratio analysis above, however, this is not to be your only source of information for the investment decision. You may use articles about the company found in publications or financial analyst reports to support your decision. Remember to demonstrate your research through appropriate referencing of any article you use. The IBIS World Report could be used to search for information on your company and/or industry. Provide a citation list for any sources used. Be sure to provide a conclusion on your decision to invest or not invest in this company's stock." LIQUIDITY Days Sales in Receivables Accounts Receivable Turnover A/R Turnover in Days Days Sales in Inventory Inventory Turnover Inventory Turnover in Days Operating Cycle Working Capital Current Ratio Acid Test Cash Ratio Sales to Working Capital Cash Flow/Cur. Mat. of Debt & NP 2018 37.72 10.48 34.84 18.24 19.11 19.10 53.94 28,554 1.14 0.76 0.38 -115.36 50.12 2017 32.09 11.55 31.60 21.75 18.75 19.47 51.07 (42,321) 0.82 0.51 0.22 -13.09 7.42 2016 34.87 12.83 28.44 21.28 19.76 18.47 46.91 (78,529) 0.70 0.48 0.23 -15.16 3.54 2015 28.80 21.04 (14,584) 0.89 0.63 0.33 55.23 LONG-TERM DEBT-PAYING ABILITY Times Interest Earned Fixed Charge Coverage Debt Ratio Debt/Equity Debt to Tangible Net Worth Cash Flow/Total Debt 2018 17.98 17.98 76.38% 323.32% -204.32% 18.64% 2017 28.44 28.44 63.36% 172.92% -261.19% 18.51% 2016 39.16 39.16 64.95% 185.32% -241.24% 17.57% 2015 40.92 40.92 51.62% 106.72% -690.00% 32.57% PROFITABILITY Net Profit Margin Total Asset Turnover Return on Assets Operating Income Margin Operating Asset Turnover Return on Operating Assets Sales to Fixed Assets Return on Investment Return on Total Equity Return on Common Equity Gross Profit Margin 2018 15.33% 0.65 9.99% 29.25% 1.95 56.92% 3.98 12.86% 33.68% 33.68% 51.43% 2017 13.38% 0.70 9.37% 26.32% 2.09 55.00% 4.09 12.41% 26.14% 26.14% 55.22% 2016 12.27% 0.80 9.86% 26.16% 2.32 60.66% 4.56 13.18% 24.75% 24.75% 59.46% 2015 12.69% 22.90% 60.48% INVESTOR ANALYSIS Degree of Financial Leverage Earnings per Share Price/Earnings Ratio Percentage of Earnings Retained Dividend Payout Dividend Yield Book Value per Share Materiality of Options. Oper. Cash Flow per Share. Oper. Cash Flow/Cash Dividends Year-end Market Price 2018 1.06 1.39 0.00 25.38% 74.10% 3.60 2.12 2.04 2017 1.04 1.15 0.00 27.14% 76.02% 4.67 1.48 1.72 2016 1.03 0.92 0.00 37.63% 67.14% 4.50 1.44 2.38 2015 1.03 0.73 0.00 45.02% 59.89% 3.52 1.21 2.82
Step by Step Solution
There are 3 Steps involved in it
Step: 1
Dominos Pizza Enterprises Limited DPE is the largest pizza chain in Australia in terms of network st...
Get Instant Access to Expert-Tailored Solutions
See step-by-step solutions with expert insights and AI powered tools for academic success
Step: 2

Step: 3

Ace Your Homework with AI
Get the answers you need in no time with our AI-driven, step-by-step assistance
Get Started


