

Question: Provide adequate solutions for the questions attached below. 2. At this point, we can analyze (stability, steady-state gain, sinusoidal steady-state gains, time-constant, etc.) of first-order,


Provide adequate solutions for the questions attached below.
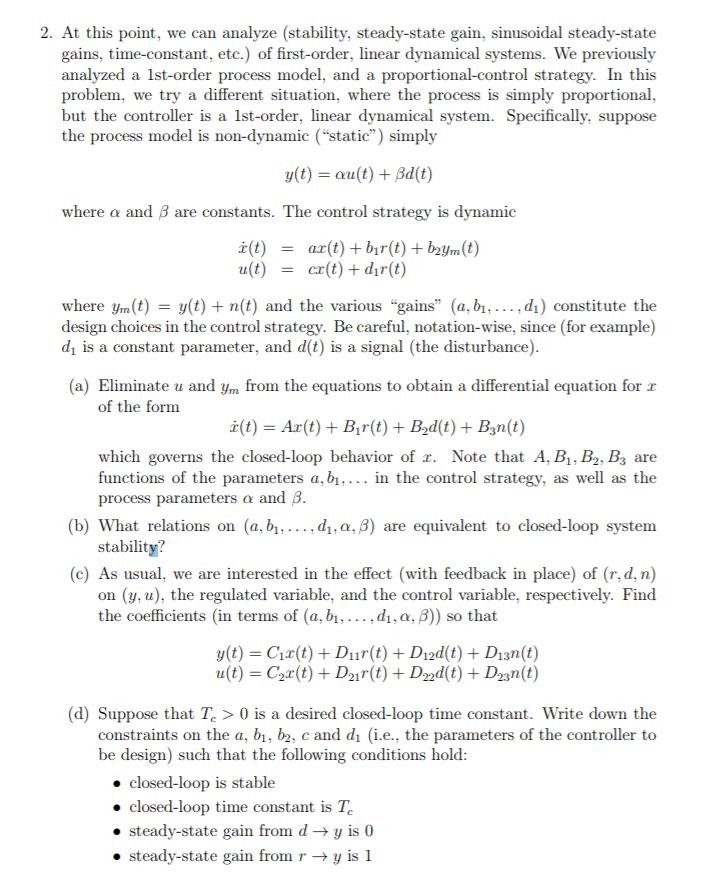
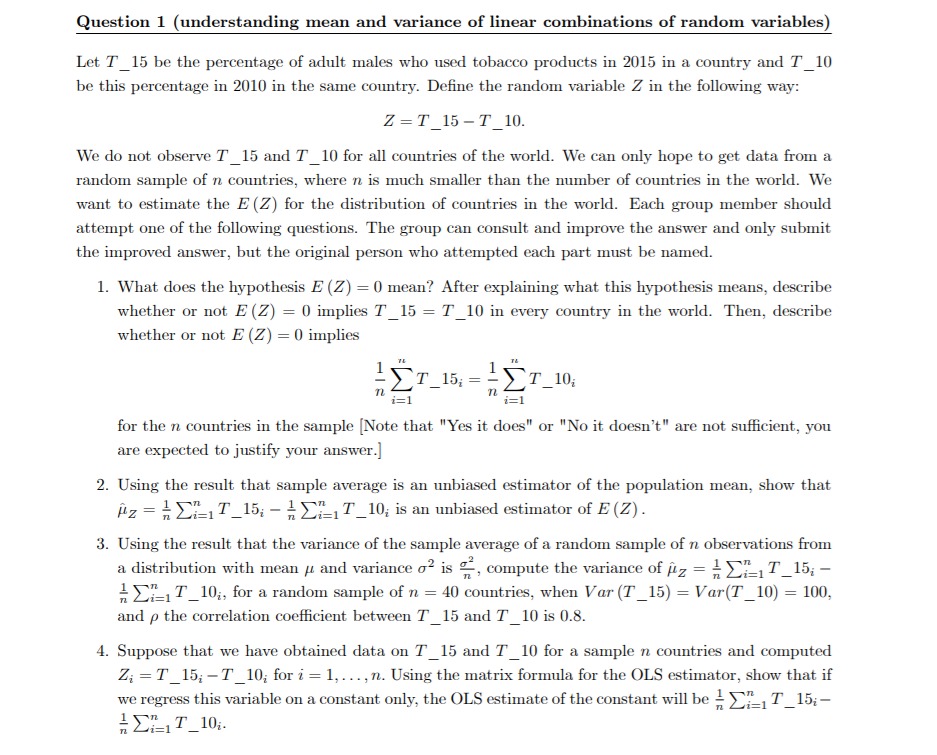

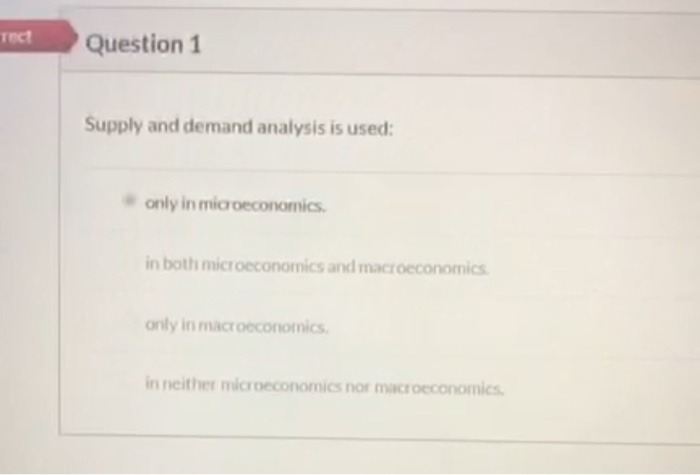
2. At this point, we can analyze (stability, steady-state gain, sinusoidal steady-state gains, time-constant, etc.) of first-order, linear dynamical systems. We previously analyzed a Ist-order process model, and a proportional-control strategy. In this problem, we try a different situation, where the process is simply proportional, but the controller is a Ist-order, linear dynamical system. Specifically, suppose the process model is non-dynamic ("static" ) simply y(t) = cu(t) + Bd(t) where o and B are constants. The control strategy is dynamic i (t) = ar(t) + bir(t) + bzym(t) u(t) = cr(t) + dir(t) where ym(t) = y(t) + n(t) and the various "gains" (a, bi, . .., di) constitute the design choices in the control strategy. Be careful, notation-wise, since (for example) d, is a constant parameter, and d(t) is a signal (the disturbance). (a) Eliminate u and ym from the equations to obtain a differential equation for r of the form r(t) = Ar(t) + Bir(t) + Bad(t) + Ban(t) which governs the closed-loop behavior of r. Note that A, B1, B2, By are functions of the parameters a, b1, ... in the control strategy, as well as the process parameters o and B. (b) What relations on (a, b1. .... dj, or, B) are equivalent to closed-loop system stability? (c) As usual, we are interested in the effect (with feedback in place) of (r, d, n) on (y, u), the regulated variable, and the control variable, respectively. Find the coefficients (in terms of (a, bi, . . ., d1, 0, B)) so that y(t) = Cix(t) + Dur(t) + Died(t) + Dian(t) u(t) = Car(t) + Dar(t) + Dad(t) + Dzan(t) (d) Suppose that T. > 0 is a desired closed-loop time constant. Write down the constraints on the a, b1, b2, c and di (i.e., the parameters of the controller to be design) such that the following conditions hold: . closed-loop is stable . closed-loop time constant is To . steady-state gain from d -> y is 0 . steady-state gain from r - y is 12. At this point, we can analyze (stability, steady-state gain, sinusoidal steady-state gains, time-constant, etc.) of first-order, linear dynamical systems. We previously analyzed a Ist-order process model, and a proportional-control strategy. In this problem, we try a different situation, where the process is simply proportional, but the controller is a Ist-order, linear dynamical system. Specifically, suppose the process model is non-dynamic ("static" ) simply y(t) = cu(t) + Bd(t) where o and B are constants. The control strategy is dynamic i (t) = ar(t) + bir(t) + bzym(t) u(t) = cr(t) + dir(t) where ym(t) = y(t) + n(t) and the various "gains" (a, bi, . .., di) constitute the design choices in the control strategy. Be careful, notation-wise, since (for example) d, is a constant parameter, and d(t) is a signal (the disturbance). (a) Eliminate u and ym from the equations to obtain a differential equation for r of the form r(t) = Ar(t) + Bir(t) + Bad(t) + Ban(t) which governs the closed-loop behavior of r. Note that A, B1, B2, By are functions of the parameters a, b1, ... in the control strategy, as well as the process parameters o and B. (b) What relations on (a, b1. .... dj, or, B) are equivalent to closed-loop system stability? (c) As usual, we are interested in the effect (with feedback in place) of (r, d, n) on (y, u), the regulated variable, and the control variable, respectively. Find the coefficients (in terms of (a, bi, . . ., d1, 0, B)) so that y(t) = Cix(t) + Dur(t) + Died(t) + Dian(t) u(t) = Car(t) + Dar(t) + Dad(t) + Dzan(t) (d) Suppose that T. > 0 is a desired closed-loop time constant. Write down the constraints on the a, b1, b2, c and di (i.e., the parameters of the controller to be design) such that the following conditions hold: . closed-loop is stable . closed-loop time constant is To . steady-state gain from d -> y is 0 . steady-state gain from r - y is 1Question 1 (understanding mean and variance of linear combinations of random variables) Let T_15 be the percentage of adult males who used tobacco products in 2015 in a country and T_10 be this percentage in 2010 in the same country. Define the random variable Z in the following way: Z =T_15 -T_10. We do not observe T_15 and T_10 for all countries of the world. We can only hope to get data from a random sample of n countries, where n is much smaller than the number of countries in the world. We want to estimate the E (Z) for the distribution of countries in the world. Each group member should attempt one of the following questions. The group can consult and improve the answer and only submit the improved answer, but the original person who attempted each part must be named. 1. What does the hypothesis E (Z) = 0 mean? After explaining what this hypothesis means, describe whether or not E (Z) = 0 implies T_15 = T_10 in every country in the world. Then, describe whether or not E (Z) = 0 implies -Er_15; = -Er_10; 1= 1 1= 1 for the n countries in the sample [Note that "Yes it does" or "No it doesn't" are not sufficient, you are expected to justify your answer.] 2. Using the result that sample average is an unbiased estimator of the population mean, show that iz = MET_15; - MELT_10; is an unbiased estimator of E (Z) . 3. Using the result that the variance of the sample average of a random sample of n observations from a distribution with mean / and variance o' is , compute the variance of /z = > >_,T_15; - " Ein T_10;, for a random sample of n = 40 countries, when Var (T_15) = Var(T_10) = 100, and p the correlation coefficient between 7_15 and T_10 is 0.8. 4. Suppose that we have obtained data on T_15 and T_10 for a sample n countries and computed Z; =T_15; -T_10; for i = 1, ..., n. Using the matrix formula for the OLS estimator, show that if we regress this variable on a constant only, the OLS estimate of the constant will be ! )_, T_15;- = ELIT_10.Question 1 (understanding mean and variance of linear combinations of random variables) Let T_15 be the percentage of adult males who used tobacco products in 2015 in a country and T_10 be this percentage in 2010 in the same country. Define the random variable Z in the following way: Z =T_15 -T_10. We do not observe T_15 and T_10 for all countries of the world. We can only hope to get data from a random sample of n countries, where n is much smaller than the number of countries in the world. We want to estimate the E (Z) for the distribution of countries in the world. Each group member should attempt one of the following questions. The group can consult and improve the answer and only submit the improved answer, but the original person who attempted each part must be named. 1. What does the hypothesis E (Z) = 0 mean? After explaining what this hypothesis means, describe whether or not E (Z) = 0 implies T_15 = T_10 in every country in the world. Then, describe whether or not E (Z) = 0 implies -Er_15; = -Er_10; 1= 1 1= 1 for the n countries in the sample [Note that "Yes it does" or "No it doesn't" are not sufficient, you are expected to justify your answer.] 2. Using the result that sample average is an unbiased estimator of the population mean, show that iz = MET_15; - MELT_10; is an unbiased estimator of E (Z) . 3. Using the result that the variance of the sample average of a random sample of n observations from a distribution with mean / and variance o' is , compute the variance of /z = > >_,T_15; - " Ein T_10;, for a random sample of n = 40 countries, when Var (T_15) = Var(T_10) = 100, and p the correlation coefficient between 7_15 and T_10 is 0.8. 4. Suppose that we have obtained data on T_15 and T_10 for a sample n countries and computed Z; =T_15; -T_10; for i = 1, ..., n. Using the matrix formula for the OLS estimator, show that if we regress this variable on a constant only, the OLS estimate of the constant will be ! )_, T_15;- = ELIT_10.rect Question 1 Supply and demand analysis is used: only in microeconomics. in both microeconomics and macroeconomics only in macroeconomics, in neither microeconomics nor macroeconomics
Step by Step Solution
There are 3 Steps involved in it

Get step-by-step solutions from verified subject matter experts