Answered step by step
Verified Expert Solution
Link Copied!

Question

1 Approved Answer

Provide Graphs and Solve the following: Course Hero x () 810 Blood Tep. Termes X D Asalynments -2021063471 X MAT1540SUNYGenEd/ du/bocswebdav/pid-949433-dt-content-rid-6148523_1/courses/202105 MAT-1540-3471/MAT1540SUNYGenEdAssessment.docx tors 3. sessment.docx

Provide Graphs and Solve the following:
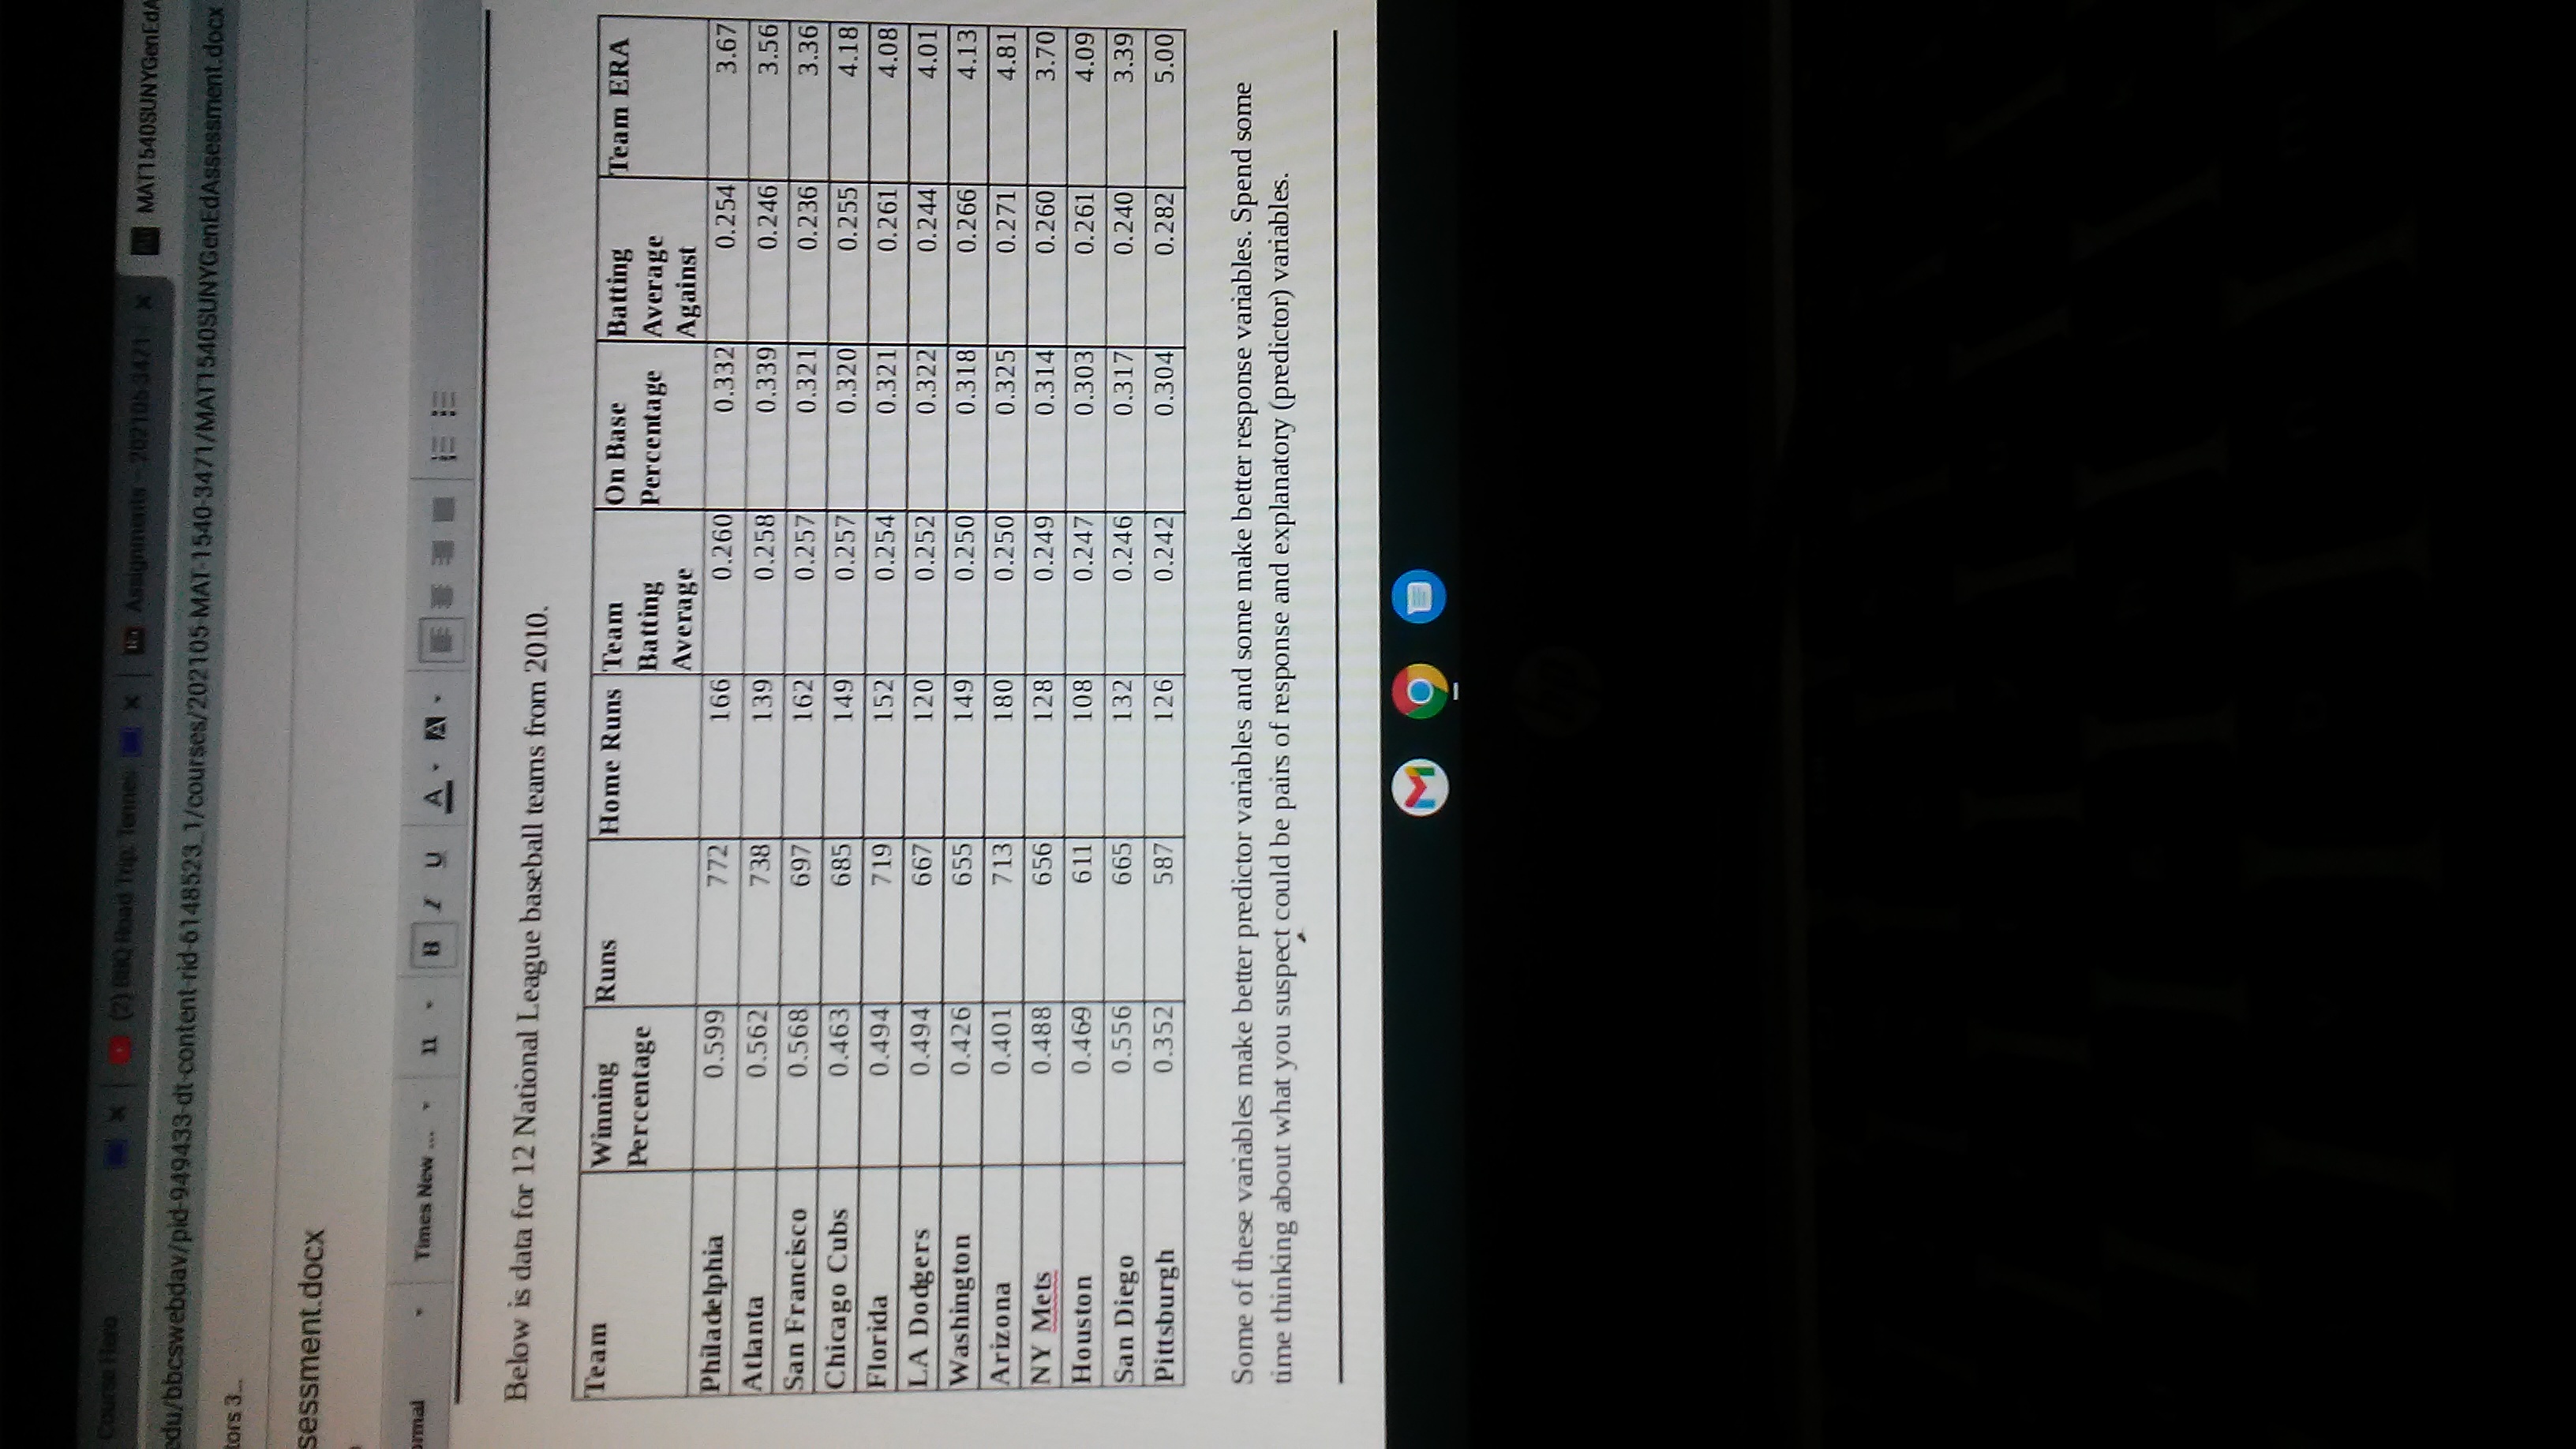
image text in transcribedimage text in transcribed
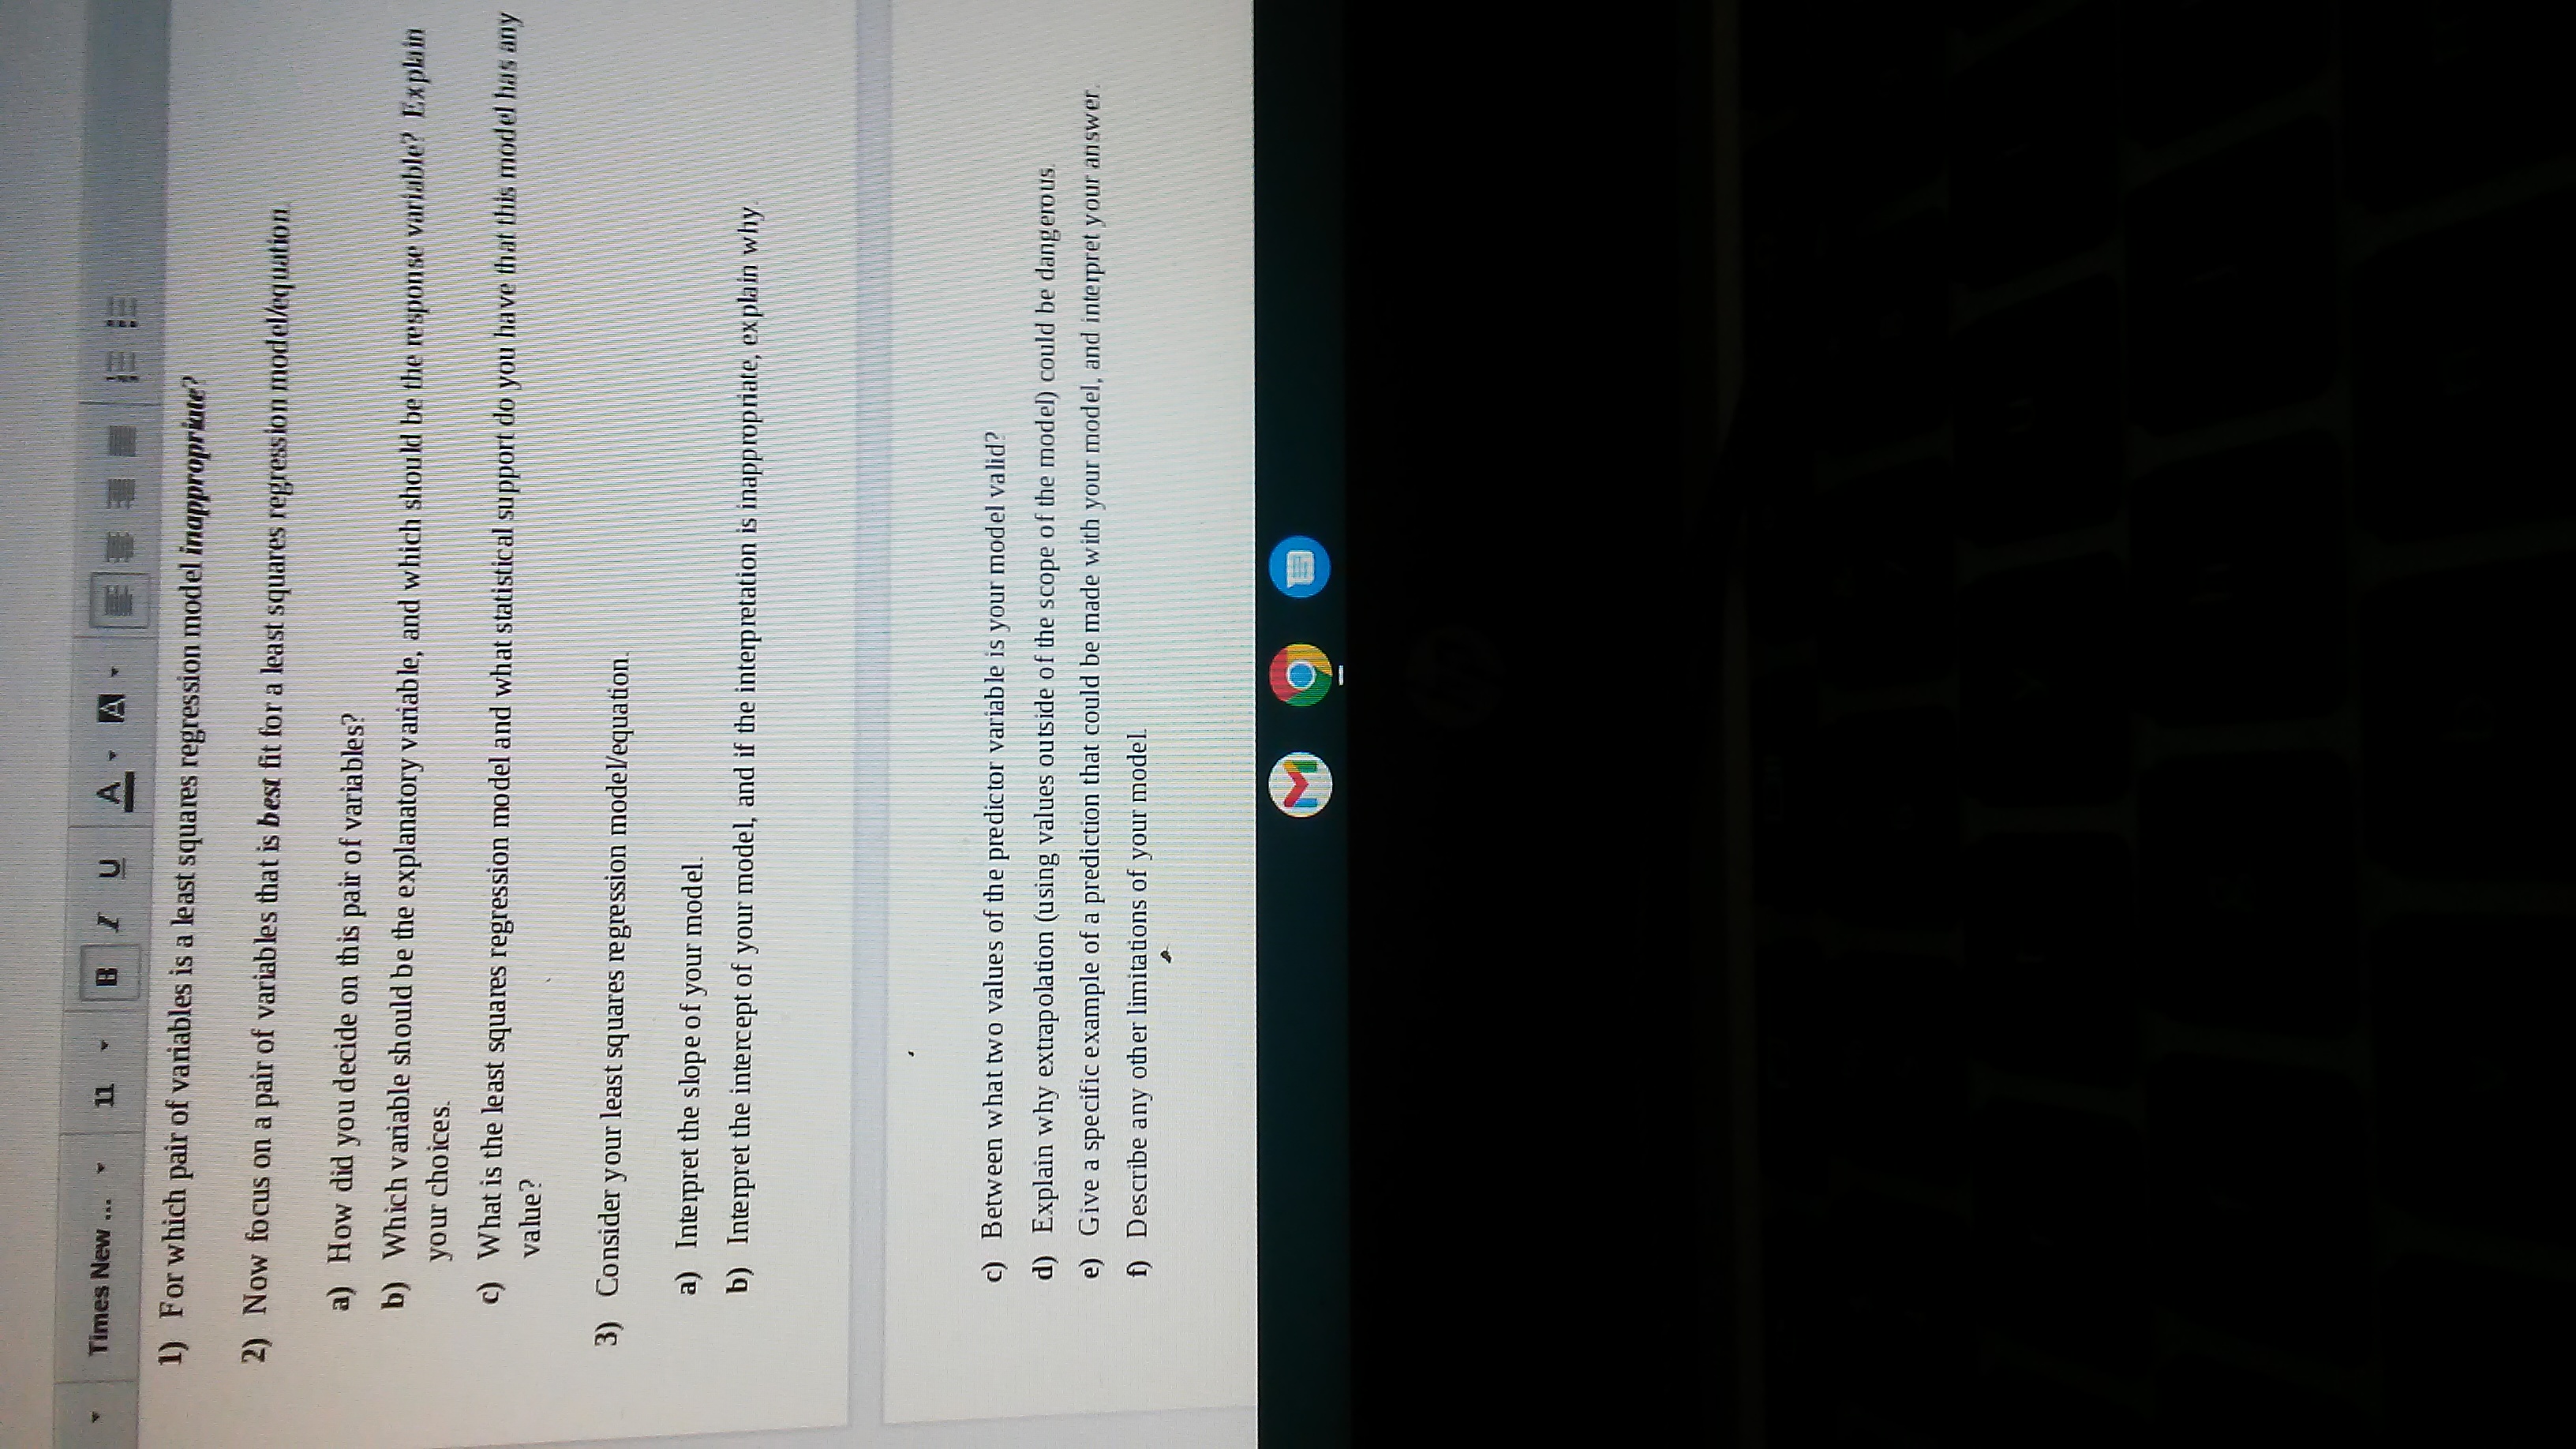
Course Hero x () 810 Blood Tep. Termes X D Asalynments -2021063471 X MAT1540SUNYGenEd/ du/bocswebdav/pid-949433-dt-content-rid-6148523_1/courses/202105 MAT-1540-3471/MAT1540SUNYGenEdAssessment.docx tors 3. sessment.docx rmal Times New ... BIUAN. FE Below is data for 12 National League baseball teams from 2010. Team Winning Runs Home Runs Team On Base Percentage Batting Team ERA Batting Percentage Average Average Against Philadelphia 0.599 772 166 0.260 0.332 0.254 Atlanta 3.67 0.562 738 139 0.258 0.339 0.246 3.56 San Francisco 0.568 697 162 0.257 0.321 0.236 3.36 Chicago Cubs 0.463 685 149 0.257 0.320 0.255 4.18 Florida 0.494 719 152 0.254 0.321 0.261 4.08 LA Dodgers 0.494 667 120 0.252 0.322 0.244 4.01 Washington 0.426 655 149 0.250 0.318 0.266 4.13 Arizona 0.401 713 180 0.250 0.325 0.271 4.81 NY Mets 0.488 656 128 0.249 0.314 0.260 3.70 Houston 0.469 611 108 0.247 0.303 0.261 4.09 San Diego 0.556 665 132 0.246 0.317 0.240 3.39 Pittsburgh 0.352 587 126 0.242 0.304 0.282 5.00 Some of these variables make better predictor variables and some make better response variables. Spend some time thinking about what you suspect could be pairs of response and explanatory (predictor) variables. OTimes New ... 11 B A. A. 1) For which pair of variables is a least squares regression model inappropriate? 2) Now focus on a pair of variables that is best fit for a least squares regression model/equation a) How did you decide on this pair of variables? b) Which variable should be the explanatory variable, and which should be the response variable? Explain your choices. c) What is the least squares regression model and what statistical support do you have that this model has any value? 3) Consider your least squares regression model/equation. a) Interpret the slope of your model. b) Interpret the intercept of your model, and if the interpretation is inappropriate, explain why c) Between what two values of the predictor variable is your model valid? d) Explain why extrapolation (using values outside of the scope of the model) could be dangerous. e) Give a specific example of a prediction that could be made with your model, and interpret your answer. f) Describe any other limitations of your model

Step by Step Solution

There are 3 Steps involved in it

Step: 1

blur-text-image

Get Instant Access to Expert-Tailored Solutions

See step-by-step solutions with expert insights and AI powered tools for academic success

Step: 2

blur-text-image_2

Step: 3

blur-text-image_3

Ace Your Homework with AI

Get the answers you need in no time with our AI-driven, step-by-step assistance

Get Started

Recommended Textbook for

An Introduction to the Mathematics of financial Derivatives

Authors: Salih N. Neftci

2nd Edition

978-0125153928, 9780080478647, 125153929, 978-0123846822

More Books

Students also viewed these Mathematics questions