

Question
Provide R code, output and written interpretation for parts a), b), c), of this question. Assume the data meets the assumption of MVN (do not
Provide R code, output and written interpretation for parts a), b), c), of this question. Assume the data meets the assumption of MVN (do not test for MVN).
a). Use the structure function and describe the structure of the iris_2023.txt dataset. In the context of MANOVA list the dependent and independent variables and define the relationship that the MANOVA would test. What type of variable does SPECIES need to be for MANOVA . Make sure you have converted this variable if necessary before attempting the analysis in later parts of Question 2.
b). Produce a draftsman display for four flower characteristic variables. Use the function scatterplotMatrix for the draftsman and check the help documentation (?scatterplotMatrix) to help you produce the plot with observations grouped by species using different colours and include the associated legend. Your plot should not include smoothing, regression lines, or distribution curves in the diagonal panels of the plot. Interpret these plots. What are the y and x axes on plot [3,2] of the scatterplotMatrix? Hint: to move the legend in scatterplotMatrix try something like: legend=list(coords=bottomleft).
c). Using MANOVA in R, test for differences in flower characteristics between the three species. Include results using all four test statistics covered in this course and interpret output. Include a sentence about what these results mean in terms of within and between group variances in general.
c-1). Which of the four tests used in part c) would be the best to interpret if there are concerns about multivariate normality or covariance equality?
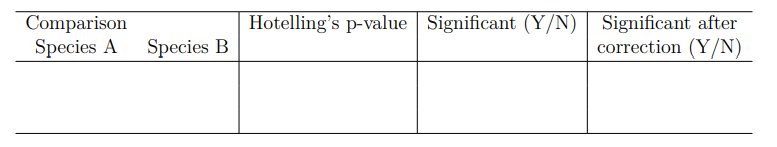
c-2). Perform analysis that specifically compares each of the species with each other (you should have 3 comparisons) using Hotellings T2 test and a significance level of 0.05. Determine the multiple test corrected significance level. Do not provide R output; instead reproduce and complete the following table for all comparisons and interpret.
c-3). Produce a table of the sample sizes by species. Do you think sample sizes could have affected the results from parts c) and e)? In general, do you think deviation from MVN would influence these results?
iris_2023.txt datase:
Obs SEPALLEN SEPALWID PETALLEN PETALWID SPECIES 1 50.0 33.0 14.0 2.0 1 2 64.0 28.0 56.0 22.0 3 3 65.0 28.0 46.0 15.0 2 4 67.0 31.0 56.0 24.0 3 5 63.0 28.0 51.0 15.0 3 6 46.0 34.0 14.0 3.0 1 7 69.0 31.0 51.0 23.0 3 8 62.0 22.0 45.0 15.0 2 9 59.0 32.0 48.0 18.0 2 10 46.0 36.0 10.0 2.0 1 11 61.0 30.0 46.0 14.0 2 12 60.0 27.0 51.0 16.0 2 13 65.0 30.0 52.0 20.0 3 14 56.0 25.0 39.0 11.0 2 15 65.0 30.0 55.0 18.0 3 16 58.0 27.0 51.0 19.0 3 17 68.0 32.0 59.0 23.0 3 18 51.0 33.0 17.0 5.0 1 19 57.0 28.0 45.0 13.0 2 20 62.0 34.0 54.0 23.0 3 21 77.0 38.0 67.0 22.0 3 22 63.0 33.0 47.0 16.0 2 23 67.0 33.0 57.0 25.0 3 24 76.0 30.0 66.0 21.0 3 25 49.0 25.0 45.0 17.0 3 26 55.0 35.0 13.0 2.0 1 27 67.0 30.0 52.0 23.0 3 28 70.0 32.0 47.0 14.0 2 29 64.0 32.0 45.0 15.0 2 30 61.0 28.0 40.0 13.0 2 31 48.0 31.0 16.0 2.0 1 32 59.0 30.0 51.0 18.0 3 33 55.0 24.0 38.0 11.0 2 34 63.0 25.0 50.0 19.0 3 35 64.0 32.0 53.0 23.0 3 36 52.0 34.0 14.0 2.0 1 37 49.0 36.0 14.0 1.0 1 38 54.0 30.0 45.0 15.0 2 39 79.0 38.0 64.0 20.0 3 40 44.0 32.0 13.0 2.0 1 41 67.0 33.0 57.0 21.0 3 42 50.0 35.0 16.0 6.0 1 43 58.0 26.0 40.0 12.0 2 44 44.0 30.0 13.0 2.0 1 45 77.0 28.0 67.0 20.0 3 46 63.0 27.0 49.0 18.0 3 47 47.0 32.0 16.0 2.0 1 48 55.0 26.0 44.0 12.0 2 49 50.0 23.0 33.0 10.0 2 50 72.0 32.0 60.0 18.0 3 51 48.0 30.0 14.0 3.0 1 52 51.0 38.0 16.0 2.0 1 53 61.0 30.0 49.0 18.0 3 54 48.0 34.0 19.0 2.0 1 55 50.0 30.0 16.0 2.0 1 56 50.0 32.0 12.0 2.0 1 57 61.0 26.0 56.0 14.0 3 58 64.0 28.0 56.0 21.0 3 59 43.0 30.0 11.0 1.0 1 60 58.0 40.0 12.0 2.0 1 61 51.0 38.0 19.0 4.0 1 62 67.0 31.0 44.0 14.0 2 63 62.0 28.0 48.0 18.0 3 64 49.0 30.0 14.0 2.0 1 65 51.0 35.0 14.0 2.0 1 66 56.0 30.0 45.0 15.0 2 67 58.0 27.0 41.0 10.0 2 68 50.0 34.0 16.0 4.0 1 69 46.0 32.0 14.0 2.0 1 70 60.0 29.0 45.0 15.0 2 71 57.0 26.0 35.0 10.0 2 72 57.0 44.0 15.0 4.0 1 73 50.0 36.0 14.0 2.0 1 74 77.0 30.0 61.0 23.0 3 75 63.0 34.0 56.0 24.0 3 76 58.0 27.0 51.0 19.0 3 77 57.0 29.0 42.0 13.0 2 78 72.0 30.0 58.0 16.0 3 79 54.0 34.0 15.0 4.0 1 80 52.0 41.0 15.0 1.0 1 81 71.0 30.0 59.0 21.0 3 82 64.0 31.0 55.0 18.0 3 83 60.0 30.0 48.0 18.0 3 84 63.0 29.0 56.0 18.0 3 85 49.0 24.0 33.0 10.0 2 86 56.0 27.0 42.0 13.0 2 87 57.0 30.0 42.0 12.0 2 88 55.0 42.0 14.0 2.0 1 89 49.0 31.0 15.0 2.0 1 90 77.0 26.0 69.0 23.0 3
Step by Step Solution
There are 3 Steps involved in it
Step: 1

Get Instant Access to Expert-Tailored Solutions
See step-by-step solutions with expert insights and AI powered tools for academic success
Step: 2

Step: 3
Ace Your Homework with AI
Get the answers you need in no time with our AI-driven, step-by-step assistance
Get Started
Database Application Development And Design
Authors: Michael V. Mannino
1st Edition
0072463678, 978-0072463675