

Answered step by step
Verified Expert Solution
Question
1 Approved Answer
Provided Information The JTP Company, located in Jenkintown, PA, is a small manufacturer and distributor of custom machined components. Because of some successful new products
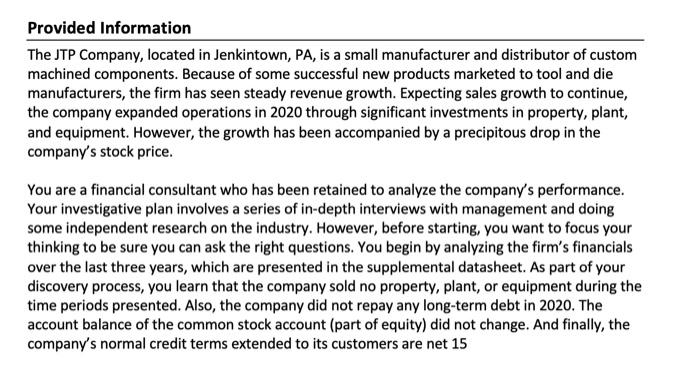
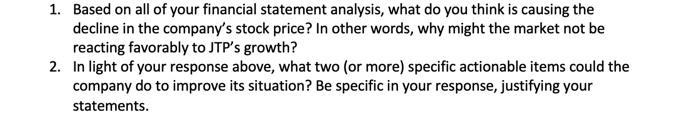
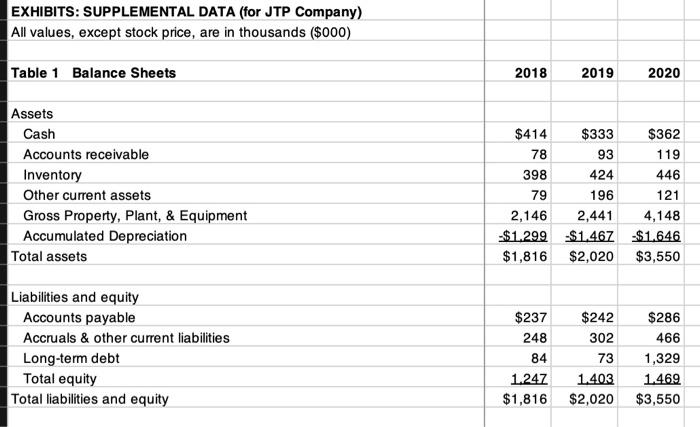
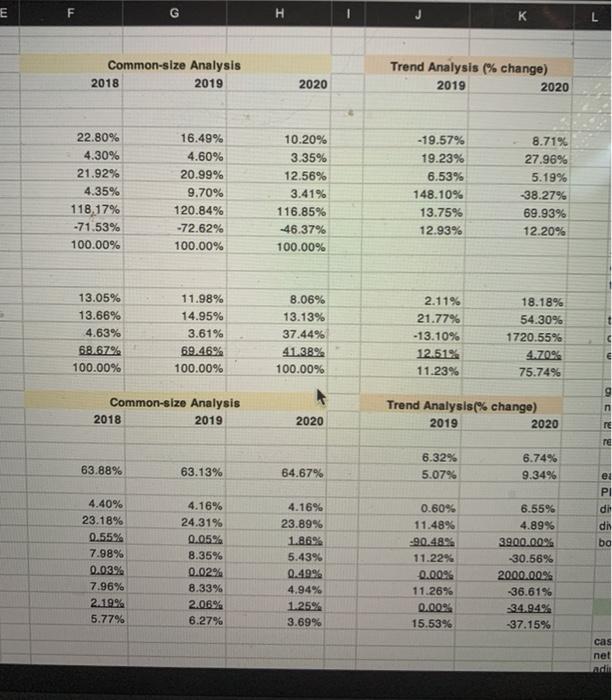
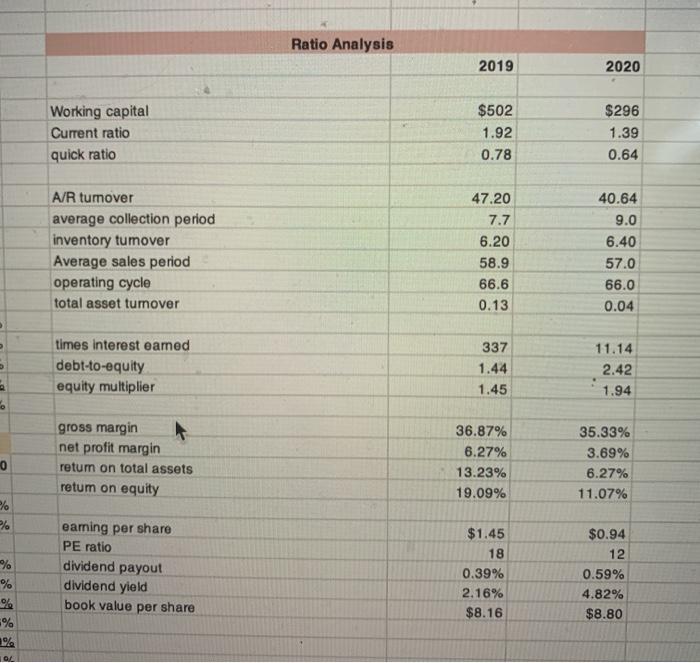
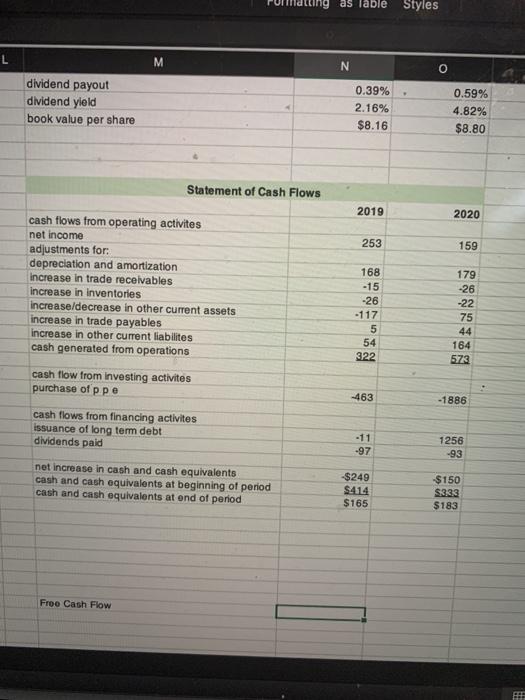 Provided Information The JTP Company, located in Jenkintown, PA, is a small manufacturer and distributor of custom machined components. Because of some successful new products marketed to tool and die manufacturers, the firm has seen steady revenue growth. Expecting sales growth to continue, the company expanded operations in 2020 through significant investments in property, plant, and equipment. However, the growth has been accompanied by a precipitous drop in the company's stock price. You are a financial consultant who has been retained to analyze the company's performance. Your investigative plan involves a series of in-depth interviews with management and doing some independent research on the industry. However, before starting, you want to focus your thinking to be sure you can ask the right questions. You begin by analyzing the firm's financials over the last three years, which are presented in the supplemental datasheet. As part of your discovery process, you learn that the company sold no property, plant, or equipment during the time periods presented. Also, the company did not repay any long-term debt in 2020. The account balance of the common stock account (part of equity) did not change. And finally, the company's normal credit terms extended to its customers are net 15 1. Based on all of your financial statement analysis, what do you think is causing the decline in the company's stock price? In other words, why might the market not be reacting favorably to JTP's growth? 2. In light of your response above, what two (or more) specific actionable items could the company do to improve its situation? Be specific in your response, justifying your statements. EXHIBITS: SUPPLEMENTAL DATA (for JTP Company) All values, except stock price, are in thousands ($000) Table 1 Balance Sheets Assets 2018 2019 2020 Cash $414 $333 $362 Accounts receivable 78 93 119 Inventory 398 424 446 Other current assets 79 196 121 Gross Property, Plant, & Equipment 2,146 2,441 4,148 Accumulated Depreciation $1,299 $1,467 -$1.646 Total assets $1,816 $2,020 $3,550 Liabilities and equity Accounts payable $237 $242 $286 Accruals & other current liabilities 248 302 466 Long-term debt 84 73 1,329 Total equity 1.247 1.403 1.469 Total liabilities and equity $1,816 $2,020 $3,550 Table 2 Income Statements Sales 2018 2019 2020 $3,796 $4,036 $4,308 Cost of goods sold 2,425 2,548 2,786 Operating expenses: Depreciation 167 168 179 Selling & Administrative Expense 880 981 1,029 Other Operating Expenses 21 2 80 Operating Income 303 337 234 Interest expense Pre-tax Profit Income Tax Expense Net Income 1 1 21 $302 $336 $213 83 83 54 $219 $253 $159 Table 3 Other Information Dividends Paid 2018 2019 2020 $89 $97 $93 Stock Issuance $0 $0 $0 Stock price $39.27 $26.10 $11.55 Avg. Shares outstanding 177 172 167 Avg. Interest Rate on Long-term debt 1.20% 1.40% 1.60% Effective Tax Rate 27.48% 24.70% 25.35% m G H J Common-size Analysis 2018 2019 2020 Trend Analysis (% change) 2019 2020 22.80% 16.49% 10.20% -19.57% 8.71% 4.30% 4.60% 3.35% 19.23% 27.96% 21.92% 20.99% 12.56% 6.53% 5.19% 4.35% 9.70% 3.41% 148.10% -38.27% 118,17% 120.84% 116.85% 13.75% 69.93% -71.53% -72.62% -46.37% 12.93% 12.20% 100.00% 100.00% 100.00% 13.05% 11.98% 8.06% 2.11% 18.18% 13.66% 14.95% 13.13% 21.77% 54.30% 4.63% 3.61% 37.44% -13.10% 1720.55% 68.67% 69.46% 41.38% 12.51% 4.70% 100.00% 100.00% 100.00% 11.23% 75.74% Common-size Analysis Trend Analysis(% change) n 2018 2019 2020 2019 2020 re re 6.32% 6.74% 63.88% 63.13% 64.67% 5.07% 9.34% el PI 4.40% 4.16% 4.16% 0.60% 6.55% di 23.18% 24.31% 23.89% 11.48% 4.89% di 0.55% 0.05% 1.86% -90.48% 3900.00% ba 7.98% 8.35% 5.43% 11.22% -30.56% 0.03% 0.02% 0.49% 0.00% 2000.00% 7.96% 8.33% 4.94% 11.26% -36.61% 2.19% 2.06% 1.25% 0.00% 34.94% 5.77% 6.27% 3.69% 15.53% -37.15% cas net adi L Working capital Current ratio quick ratio Ratio Analysis 2019 2020 $502 $296 1.92 1.39 0.78 0.64 A/R tumover 47.20 40.64 average collection period 7.7 9.0 inventory tumover 6.20 6.40 Average sales period 58.9 57.0 operating cycle 66.6 66.0 total asset turnover 0.13 0.04 times interest eamed 337 11.14 D debt-to-equity 1.44 2.42 equity multiplier 1.45 1.94 gross margin A 36.87% 35.33% net profit margin 6.27% 3.69% 0 return on total assets 13.23% 6.27% P% retum on equity eaming per share PE ratio 19.09% 11.07% $1.45 $0.94 18 12 % dividend payout 0.39% 0.59% % dividend yield 2.16% 4.82% % book value per share $8.16 $8.80 % 1% 10% L dividend payout dividend yield book value per share as Table Styles M N 0.39% 0.59% C 2.16% 4.82% $8.16 $8.80 Statement of Cash Flows 2019 2020 cash flows from operating activites net income 253 159 adjustments for: depreciation and amortization 168 179 increase in trade receivables -15 -26 increase in inventories -26 -22 increase/decrease in other current assets -117 75 increase in trade payables 5 44 increase in other current liabilites. 54 164 cash generated from operations 322 573 cash flow from investing activites purchase of p p e -463 -1886 cash flows from financing activites issuance of long term debt -11 1256 dividends paid -97 -93 net increase in cash and cash equivalents -$249 $150 cash and cash equivalents at beginning of period $414 $333 cash and cash equivalents at end of period $165 $183 Free Cash Flow
 Step by Step Solution
There are 3 Steps involved in it
Step: 1

Get Instant Access to Expert-Tailored Solutions
See step-by-step solutions with expert insights and AI powered tools for academic success
Step: 2

Step: 3
Ace Your Homework with AI
Get the answers you need in no time with our AI-driven, step-by-step assistance
Get Started
Cost Management Measuring Monitoring And Motivating Performance
Authors: Leslie G. Eldenburg, Susan Wolcott, Liang Hsuan Chen, Gail Cook
2nd Canadian Edition
1118168879, 9781118168875