

Answered step by step
Verified Expert Solution
Question
1 Approved Answer
P.S: Please be as detailed as possible (everything must be done using excel). I really need help understanding these questions. Thank you. Assignment 8 (DS-660)
P.S: Please be as detailed as possible (everything must be done using excel). I really need help understanding these questions. Thank you.
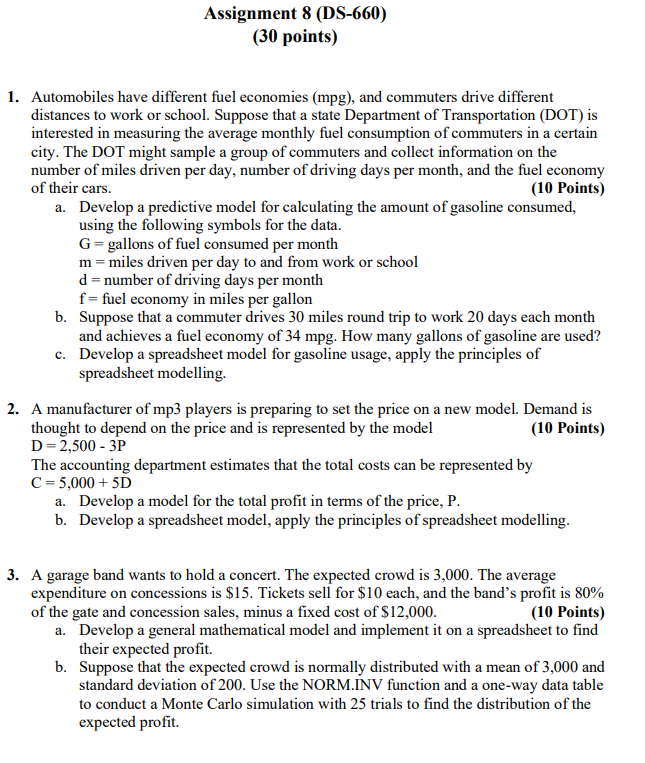
Assignment 8 (DS-660) (30 points) 1. Automobiles have different fuel economies (mpg), and commuters drive different distances to work or school. Suppose that a state Department of Transportation (DOT) is interested in measuring the average monthly fuel consumption of commuters in a certain city. The DOT might sample a group of commuters and collect information on the number of miles driven per day, number of driving days per month, and the fuel economy of their cars. (10 Points) a. Develop a predictive model for calculating the amount of gasoline consumed, using the following symbols for the data. G = gallons of fuel consumed per month m = miles driven per day to and from work or school d = number of driving days per month f = fuel economy in miles per gallon b. Suppose that a commuter drives 30 miles round trip to work 20 days each month and achieves a fuel economy of 34 mpg. How many gallons of gasoline are used? c. Develop a spreadsheet model for gasoline usage, apply the principles of spreadsheet modelling. 2. A manufacturer of mp3 players is preparing to set the price on a new model. Demand is thought to depend on the price and is represented by the model D=2,500 - 3P (10 Points) The accounting department estimates that the total costs can be represented by C =5,000+5D a. Develop a model for the total profit in terms of the price, P. b. Develop a spreadsheet model, apply the principles of spreadsheet modelling. 3. A garage band wants to hold a concert. The expected crowd is 3,000. The average expenditure on concessions is $15. Tickets sell for $10 each, and the band's profit is 80% of the gate and concession sales, minus a fixed cost of $12,000. (10 Points) a. Develop a general mathematical model and implement it on a spreadsheet to find their expected profit. b. Suppose that the expected crowd is normally distributed with a mean of 3,000 and standard deviation of 200. Use the NORM.INV function and a one-way data table to conduct a Monte Carlo simulation with 25 trials to find the distribution of the expected profit. Assignment 8 (DS-660) (30 points) 1. Automobiles have different fuel economies (mpg), and commuters drive different distances to work or school. Suppose that a state Department of Transportation (DOT) is interested in measuring the average monthly fuel consumption of commuters in a certain city. The DOT might sample a group of commuters and collect information on the number of miles driven per day, number of driving days per month, and the fuel economy of their cars. (10 Points) a. Develop a predictive model for calculating the amount of gasoline consumed, using the following symbols for the data. G = gallons of fuel consumed per month m = miles driven per day to and from work or school d = number of driving days per month f = fuel economy in miles per gallon b. Suppose that a commuter drives 30 miles round trip to work 20 days each month and achieves a fuel economy of 34 mpg. How many gallons of gasoline are used? c. Develop a spreadsheet model for gasoline usage, apply the principles of spreadsheet modelling. 2. A manufacturer of mp3 players is preparing to set the price on a new model. Demand is thought to depend on the price and is represented by the model D=2,500 - 3P (10 Points) The accounting department estimates that the total costs can be represented by C =5,000+5D a. Develop a model for the total profit in terms of the price, P. b. Develop a spreadsheet model, apply the principles of spreadsheet modelling. 3. A garage band wants to hold a concert. The expected crowd is 3,000. The average expenditure on concessions is $15. Tickets sell for $10 each, and the band's profit is 80% of the gate and concession sales, minus a fixed cost of $12,000. (10 Points) a. Develop a general mathematical model and implement it on a spreadsheet to find their expected profit. b. Suppose that the expected crowd is normally distributed with a mean of 3,000 and standard deviation of 200. Use the NORM.INV function and a one-way data table to conduct a Monte Carlo simulation with 25 trials to find the distribution of the expected profitStep by Step Solution
There are 3 Steps involved in it
Step: 1

Get Instant Access to Expert-Tailored Solutions
See step-by-step solutions with expert insights and AI powered tools for academic success
Step: 2

Step: 3
Ace Your Homework with AI
Get the answers you need in no time with our AI-driven, step-by-step assistance
Get Started
Top Actuel Fiscalité 2022-2023
Authors: Daniel Freiss,Brigitte Monnet
1st Edition
2017182176,2017879282