Answered step by step
Verified Expert Solution
Link Copied!

Question

1 Approved Answer

(&pts) Consider the figure used to illustrate Web caching below. Suppose that the ac- cess link capacity is C bits/sec and the average object size
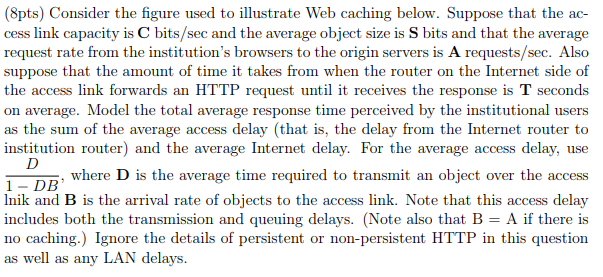
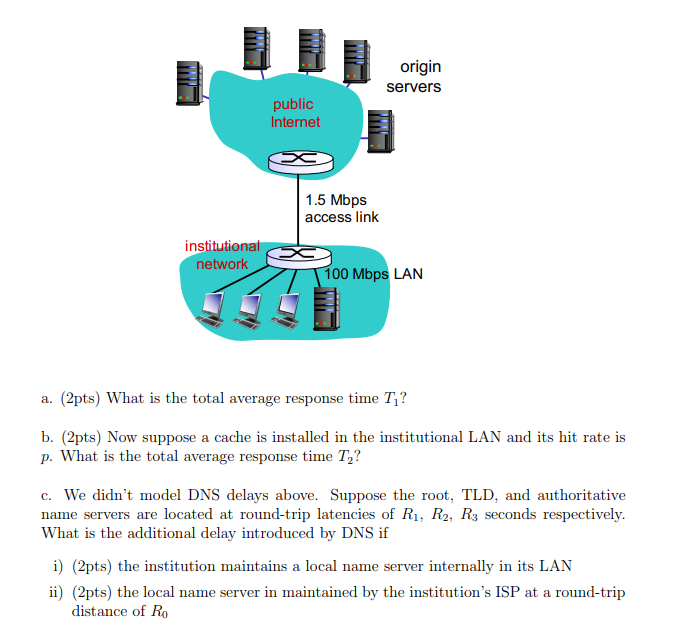
image text in transcribed

image text in transcribed

(&pts) Consider the figure used to illustrate Web caching below. Suppose that the ac- cess link capacity is C bits/sec and the average object size is S bits and that the average request rate from the institution's browsers to the origin servers is A requests/sec. Also suppose that the amount of time it takes from when the router on the Internet side of the access link forwards an HTTP request until it receives the response is T seconds on average. Model the total average response time perceived by the institutional users as the sum of the average access delay (that is, the delay from the Internet router to institution router) and the average Internet delay. For the average access delay, use 1 - DBW No, where D is the average time required to transmit an object over the access Inik and B is the arrival rate of objects to the access link. Note that this access delay includes both the transmission and queuing delays. (Note also that B = A if there is no caching.) Ignore the details of persistent or non-persistent HTTP in this question as well as any LAN delays. i origin servers origins public Internet KX 1.5 Mbps access link institutional network 100 Mbps LAN a. (2pts) What is the total average response time T ? b. (2pts) Now suppose a cache is installed in the institutional LAN and its hit rate is p. What is the total average response time T,? c. We didn't model DNS delays above. Suppose the root, TLD, and authoritative name servers are located at round-trip latencies of R1, R2, R3 seconds respectively. What is the additional delay introduced by DNS if i) (2pts) the institution maintains a local name server internally in its LAN ii) (2pts) the local name server in maintained by the institution's ISP at a round-trip distance of Ro

Step by Step Solution

There are 3 Steps involved in it

Step: 1

blur-text-image

Get Instant Access to Expert-Tailored Solutions

See step-by-step solutions with expert insights and AI powered tools for academic success

Step: 2

blur-text-image

Step: 3

blur-text-image

Ace Your Homework with AI

Get the answers you need in no time with our AI-driven, step-by-step assistance

Get Started

Recommended Textbook for

Linked Data A Geographic Perspective

Authors: Glen Hart, Catherine Dolbear

1st Edition

1000218910, 9781000218916

More Books

Students also viewed these Databases questions

Question

=+ Are there closed-shop requirements or practices?

Answered: 1 week ago