Question
Purpose: The Coomassie Brilliant Blue G-250 dye's shift in absorbance is the foundation of the Bradford assay, a colorimetric protein assay. Three different variations of


Purpose:
The Coomassie Brilliant Blue G-250 dye's shift in absorbance is the foundation of the Bradford assay, a colorimetric protein assay. Three different variations of the Coomassie Brilliant Blue G-250 dye are available: cationic (blue), neutral (green), and anionic (red). The dye's red form changes into its blue form in acidic environments, where it binds to the protein being tested. The solution will stay brown if there is no protein to bind to.
The Coomassie dye's blue form is stabilized by binding to the protein; as a result, the amount of the complex in solution serves as a gauge for the protein concentration and can be calculated using an absorbance reading. The absorption spectrum maxima for the cationic (unbound) form is traditionally thought to be at 465 nm.The greatest absorption spectrum has long been thought to be at 595 nm in the anionic bound form of the dye, which is maintained together by hydrophobic and ionic interactions.The amount of bound dye and, thus, the amount (concentration) of protein present in the sample are proportional to the rise in absorbance at 595 nm.
Procedures:
Step 1: The student will be provided with a protein stock solution of known concentration (in mg/mL).
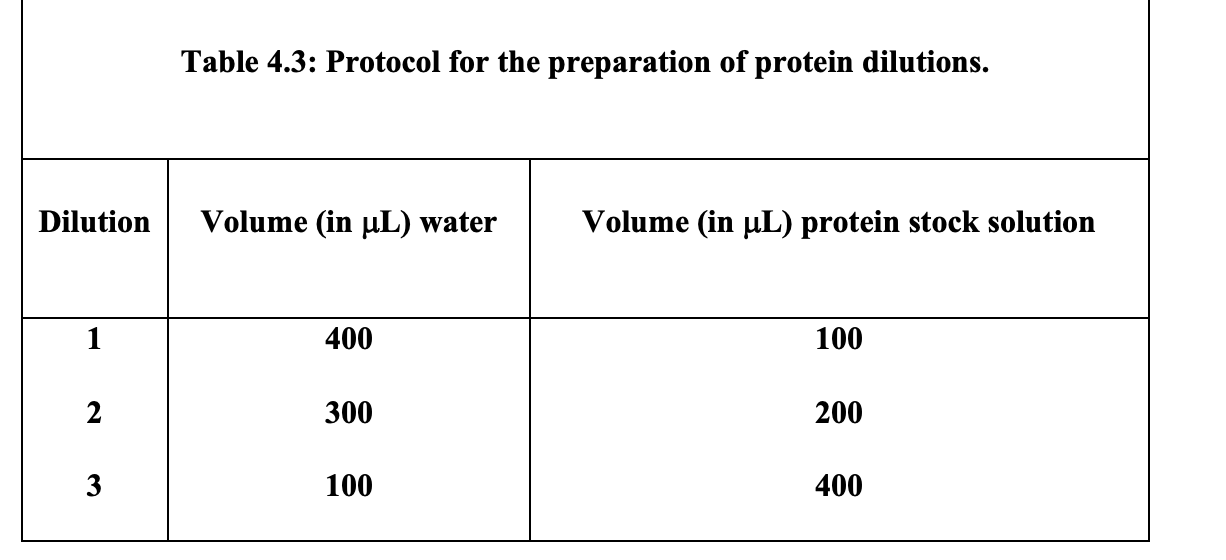
Step 2: The student will prepare three dilutions in separate test tubes according to the table shown below. These three dilutions are prepared by mixing known volumes of the protein stock solution with known volumes of water. of the protein stock solution with known volumes of water.
Step 3: Prepare five separate test tubes containing the following: A: 50 L water B: 50 L Protein standard solution 1 C: 50 L Protein standard solution 2 D: 50 L Protein standard solution 3 E: 50 L Protein stock solutionF: 50 L Unknown protein solution
Step 4: Add 250 L Bradford reagent to all test tubes and incubate at room temperature for 10 min.
Step 5: Pipet 200 L from each test tube into an individual well of a microplate and measure the absorbance at 620 nm.
Calculations:
1. For all three protein dilutions prepared according to Table 4.3, calculate the protein concentration (in mg/mL) using the protein concentration of the protein stock solution given by the instructor or TA and the equation shown below:
2. Using the absorbances measured for test tubes A through E, construct a calibration graph relating the protein concentration (in mg/mL) to the measured absorbance. The concentration of protein for test tube A is 0 mg/mL and the concentration of protein for test tube E is the concentration of the stock solution as given by the instructor or TA. The concentration of protein for test tubes B through D are the results from the calculations from step 1.
3. Perform a linear regression analysis on the calibration graph thus established and obtain the equation corresponding to this linear regression analysis.
4. Using the results from the linear regression analysis and the measured absorbance for test tube F, calculate the concentration of protein (in mg/mL) present in the unknown.
need help with calulations
Concentration of protein (in mg/mL)= Volume stock solution used (in mL ) * Concentration stock solution (in mg/mL ) Total volume (in mL ) Table 4.3: Protocol for the preparation of protein dilutionsStep by Step Solution
There are 3 Steps involved in it
Step: 1

Get Instant Access to Expert-Tailored Solutions
See step-by-step solutions with expert insights and AI powered tools for academic success
Step: 2

Step: 3

Ace Your Homework with AI
Get the answers you need in no time with our AI-driven, step-by-step assistance
Get Started


