Answered step by step
Verified Expert Solution
Link Copied!

Question

1 Approved Answer

pyhton The file associated with this question is Plotting.py. PIE CHART (10 points) - draw_pie_chart() A household has several monthly expenses, each expense falling under

pyhtonimage text in transcribedimage text in transcribedimage text in transcribed
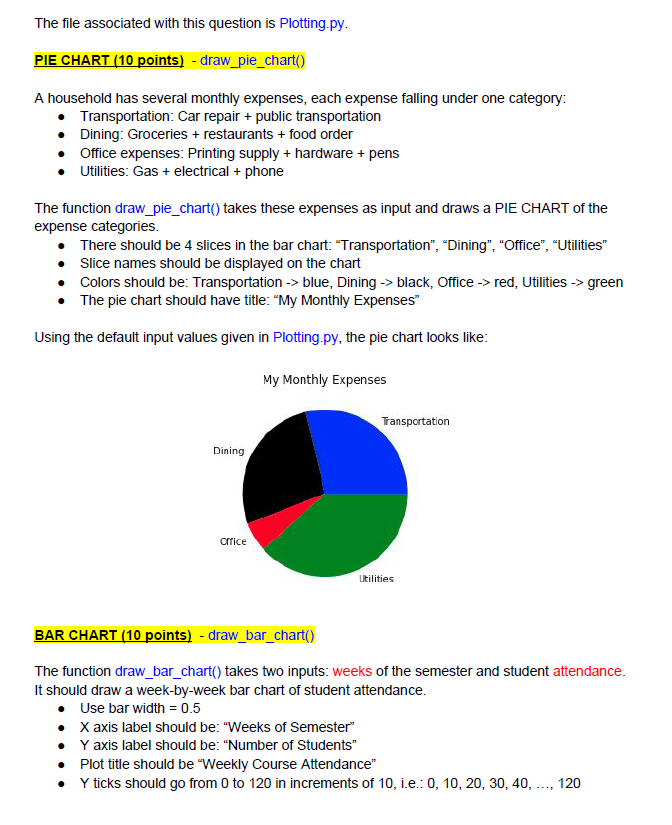
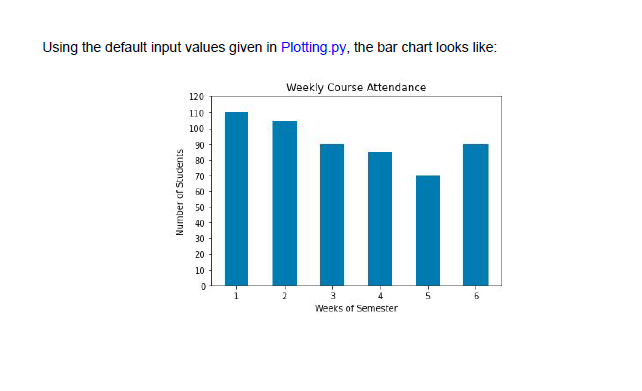
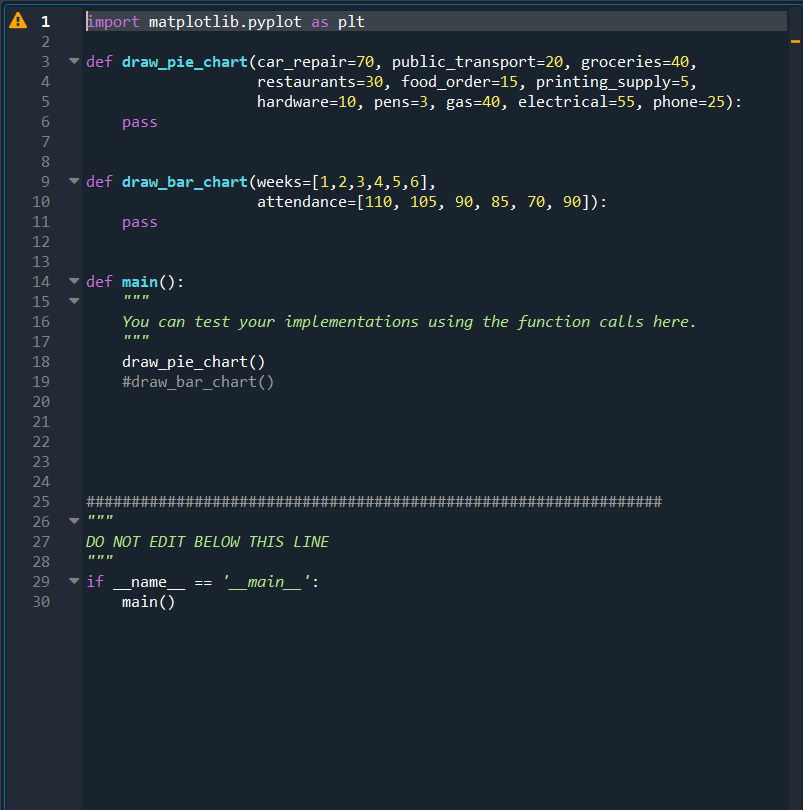
The file associated with this question is Plotting.py. PIE CHART (10 points) - draw_pie_chart() A household has several monthly expenses, each expense falling under one category: Transportation: Car repair + public transportation Dining: Groceries + restaurants + food order Office expenses: Printing supply + hardware + pens Utilities: Gas + electrical + phone The function draw_pie_chart() takes these expenses as input and draws a PIE CHART of the expense categories There should be 4 slices in the bar chart: "Transportation", "Dining", "Office", "Utilities" Slice names should be displayed on the chart Colors should be: Transportation -> blue, Dining -> black, Office -> red, Utilities -> green The pie chart should have title: "My Monthly Expenses Using the default input values given in Plotting.py, the pie chart looks like: My Monthly Expenses Transportation Dining orrice Utilities BAR CHART (10 points) - draw_bar_chart() The function draw_bar_chart() takes two inputs: weeks of the semester and student attendance. It should draw a week-by-week bar chart of student attendance. Use bar width = 0.5 Xaxis label should be: "Weeks of Semester Y axis label should be: "Number of Students" Plot title should be "Weekly Course Attendance" Y ticks should go from 0 to 120 in increments of 10, i.e.: 0, 10, 20, 30, 40, ..., 120 Using the default input values given in Plotting.py, the bar chart looks like: Weekly Course Attendance 120 110 100 90 Number of Students BO 70 60 50 40 30 20 10 0 1 3 4 5 Weeks of Semester import matplotlib.pyplot as plt def draw_pie_chart(car_repair=70, public_transport=20, groceries=40, restaurants=30, food_order=15, printing_supply=5, hardware=10, pens=3, gas-40, electrical=55, phone=25): pass def draw_bar_chart(weeks=[1,2,3,4,5,6], attendance=[110, 105, 90, 85, 70, 90]): pass def main(): A 1 2 3 4 5 6 7 8 9 10 11 12 13 14 15 16 17 18 19 20 21 22 23 24. 25 26 27 28 29 30 You can test your implementations using the function calls here. draw_pie_chart() #draw_bar_chart() DO NOT EDIT BELOW THIS LINE if name '_main_': main()

Step by Step Solution

There are 3 Steps involved in it

Step: 1

blur-text-image

Get Instant Access to Expert-Tailored Solutions

See step-by-step solutions with expert insights and AI powered tools for academic success

Step: 2

blur-text-image_2

Step: 3

blur-text-image_3

Ace Your Homework with AI

Get the answers you need in no time with our AI-driven, step-by-step assistance

Get Started

Recommended Textbook for

Database Concepts

Authors: David M. Kroenke

1st Edition

0130086509, 978-0130086501

More Books

Students also viewed these Databases questions