Answered step by step
Verified Expert Solution
Question
1 Approved Answer
PYTHON 3 CODE REQUIRED Question 2: Event Related Potentials [5 points] In neuroscience, event-related potentials (or ERPs) are the averaged electrical activity of the brain

PYTHON 3 CODE REQUIRED
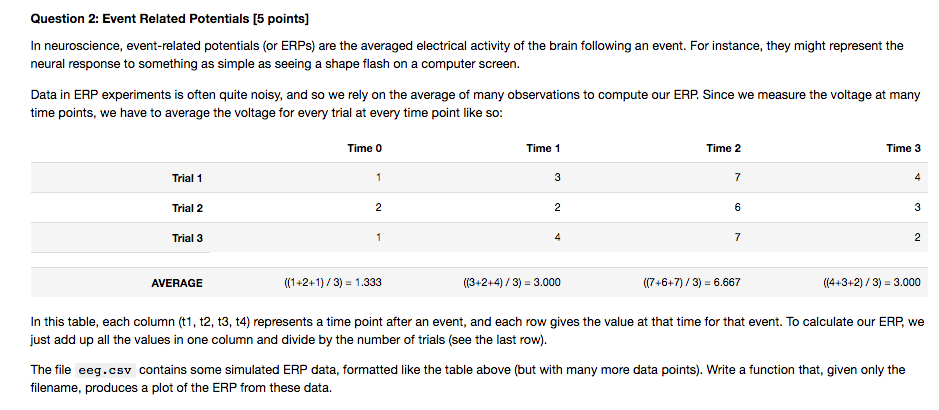
Question 2: Event Related Potentials [5 points] In neuroscience, event-related potentials (or ERPs) are the averaged electrical activity of the brain following an event. For instance, they might represent the neural response to something as simple as seeing a shape flash on a computer screen. Data in ERP experiments is often quite noisy, and so we rely on the average of many observations to compute our ERP Since we measure the voltage at many time points, we have to average the voltage for every trial at every time point like so Time 0 Time 1 Time 2 Time 3 Trial 1 4 Trial 2 Trial 3 4 AVERAGE ((1+2+1)/3) 1.333 (3+2+4)/3) 3.000 ((7+6+7)/3) 6.667 ((4+3+2)/3) 3.000 In this table, each column (t1, t2, t3, t4) represents a time point after an event, and each row gives the value at that time for that event. To calculate our ERP we just add up all the values in one column and divide by the number of trials (see the last row). The file eeg.csv contains some simulated ERP data, formatted like the table above (but with many more data points). Write a function that, given only the filename, produces a plot of the ERP from these data. Question 2: Event Related Potentials [5 points] In neuroscience, event-related potentials (or ERPs) are the averaged electrical activity of the brain following an event. For instance, they might represent the neural response to something as simple as seeing a shape flash on a computer screen. Data in ERP experiments is often quite noisy, and so we rely on the average of many observations to compute our ERP Since we measure the voltage at many time points, we have to average the voltage for every trial at every time point like so Time 0 Time 1 Time 2 Time 3 Trial 1 4 Trial 2 Trial 3 4 AVERAGE ((1+2+1)/3) 1.333 (3+2+4)/3) 3.000 ((7+6+7)/3) 6.667 ((4+3+2)/3) 3.000 In this table, each column (t1, t2, t3, t4) represents a time point after an event, and each row gives the value at that time for that event. To calculate our ERP we just add up all the values in one column and divide by the number of trials (see the last row). The file eeg.csv contains some simulated ERP data, formatted like the table above (but with many more data points). Write a function that, given only the filename, produces a plot of the ERP from these dataStep by Step Solution
There are 3 Steps involved in it
Step: 1

Get Instant Access to Expert-Tailored Solutions
See step-by-step solutions with expert insights and AI powered tools for academic success
Step: 2

Step: 3

Ace Your Homework with AI
Get the answers you need in no time with our AI-driven, step-by-step assistance
Get Started


