

Answered step by step
Verified Expert Solution
Question
1 Approved Answer
Python 3.7 Need help graphing 4 curves using Euler's Numerical Method This is my code now. I need to graph each curve with step size
Python 3.7
Need help graphing 4 curves using Euler's Numerical Method
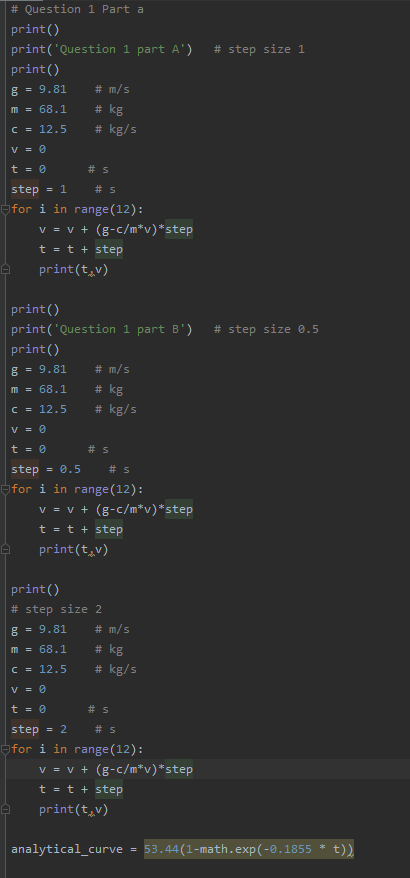
This is my code now. I need to graph each curve with step size 1, 0.5 and 2. Also, the analytical curve also needs to be graphed. All 4 curves need to go on the same graph. I am receiving the correct output values but it has been a while since I have used python and have forgot how to plot.
The analytical equation is 
Where as the equation using the step sizes is 
The end of that equation  equals the step size.
Values given are g= 9.81, m = 68.1, c = 12.5
# step size 1 # Question 1 Part a print() print('Question 1 part A') print) # m/s m = 68.1 # kg C = 12.5 8 = 9.81 # kg/s V = 0 t = 0 # 5 step = 1 # 5 for i in range(12): v = v + (8-c/m*v)*step t = t + step print(tv) - # step size 6.5 print() print('Question 1 part B') print() 8 = 9.81 # m/s m = 68.1 # kg # kg/s C = 12.5 V = 0 t = 0 # 5 step = 0.5 # 5 for i in range(12): v = v + (8-c/m*v)*step t = t + step print(t,v) print) # step size 2 8 = 9.81 # m/s m = 68.1 # kg # kg/s C = 12.5 V = 0 t = 0 # 5 step = 2 # 5 for i in range(12): v = v + (8-c/m*v) *step t = t + step G print(t,v analytical_curve = 53.44(1-math.exp(-0.1855 * t))Step by Step Solution
There are 3 Steps involved in it
Step: 1

Get Instant Access to Expert-Tailored Solutions
See step-by-step solutions with expert insights and AI powered tools for academic success
Step: 2

Step: 3
Ace Your Homework with AI
Get the answers you need in no time with our AI-driven, step-by-step assistance
Get Started