

Answered step by step
Verified Expert Solution
Question
1 Approved Answer
PYTHON 3.x Code to be fixed: def get_data(n, data): data = [] for i in range(n): data.append(input('Enter one integer only:')) def find_min_and_max(data, the_min, the_max): the_min
PYTHON 3.x 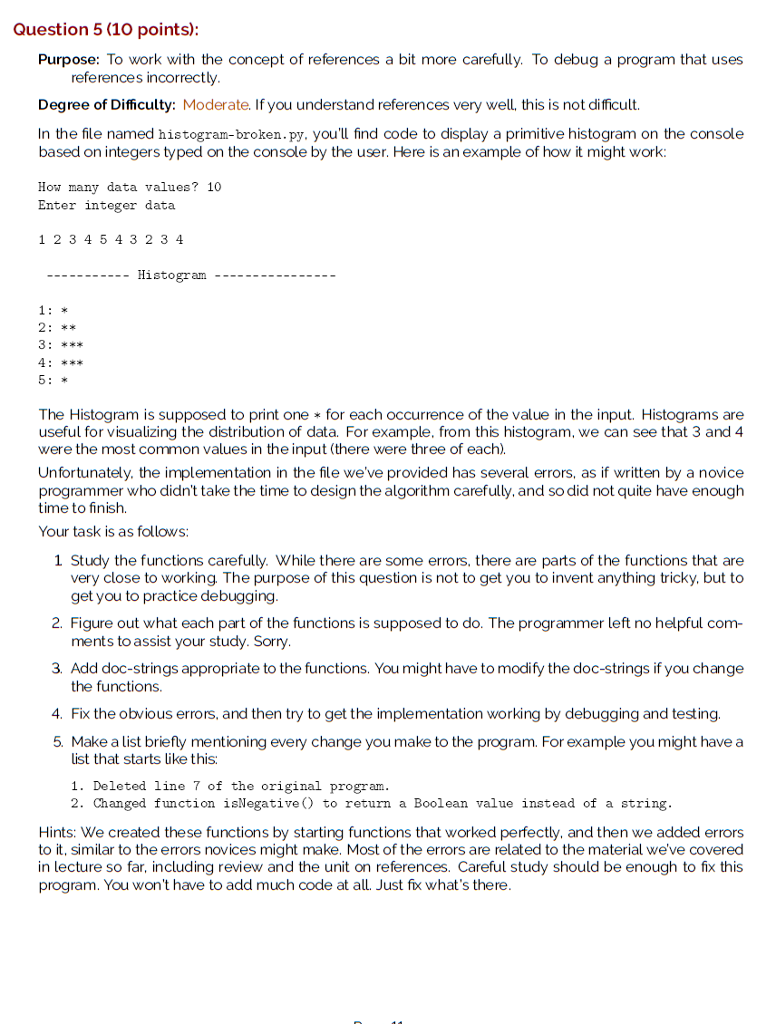
Code to be fixed:
def get_data(n, data): data = [] for i in range(n): data.append(input('Enter one integer only:')) def find_min_and_max(data, the_min, the_max): the_min = min(data) the_max = max(data) def counting(data): the_min = 0 the_max = 0 find_min_and_max(data, the_min, the_max) fsize = the_min + the_max frequency = [0]*fsize for d in data: j = d - the_min + 1 frequency[j] += 1 return frequency def draw_histogram(frequency, the_min, the_max): print(" ----------- Histogram ---------------- ") for f in frequency: print(f, '*'*f) data_size = int(input('How many data values?')) data = get_data(data_size, []) frequency = counting(data) draw_histogram(frequency,0,0) Question 5 (10 points) Purpose: To work with the concept of references a bit more carefully. To debug a program that uses references incorrectly Degree of Difficulty: Moderate. If you understand references very well, this is not difficult. In the file named histogram-broken, py, you'll find code to display a primitive histogram on the console based on integers typed on the console by the user. Here is an example of how it might work: How many data values? 10 Enter integer data 1 2 3 45 4 3 2 34 Histogram - The Histogram is supposed to print one for each occurrence of the value in the input. Histograms are useful for visualizing the distribution of data. For example, from this histogram, we can see that 3 and 4 were the most common values in the input (there were three of each). Unfortunately, the implementation in the file we've provided has several errors, as if written by a novice programmer who didn't take the time to design the algorithm carefully,and so did not quite have enough time to finish. Your task is as follows: 1 Study the functions carefully. While there are some errors, there are parts of the functions that are very close to working. The purpose of this question is not to get you to invent anything tricky, but to get you to practice debugging 2. Figure out what each part of the functions is supposed to do. The programmer left no helpful com- 3. Add doc-strings appropriate to the functions. You might have to modify the doc-strings if you change 4. Fix the obvious errors, and then try to get the implementation working by debugging and testing ments to assist your study. Sorry the functions. 5. Make a list briefly mentioning every change you make to the program. For example you might have a list that starts like this 1. Deleted line 7 of the original program 2. Changed function isNegative) to return a Boolean value instead of a string Hints: We created these functions by starting functions that worked perfectly, and then we added errors to it, similar to the errors novices might make. Most of the errors are related to the material we've covered in lecture so far, including review and the unit on references. Careful study should be enough to fix this program. You won't have to add much code at all. Just fix what's there Step by Step Solution
There are 3 Steps involved in it
Step: 1

Get Instant Access to Expert-Tailored Solutions
See step-by-step solutions with expert insights and AI powered tools for academic success
Step: 2

Step: 3
Ace Your Homework with AI
Get the answers you need in no time with our AI-driven, step-by-step assistance
Get Started
Database Design And Relational Theory Normal Forms And All That Jazz
Authors: Chris Date
1st Edition
1449328016, 978-1449328016