

Question
Python Code PLEASE FIX THE CODE and ADD the code. Note: The following information and instructions apply to students that have been assigned to Scenario
Python Code
PLEASE FIX THE CODE and ADD the code.
Note: The following information and instructions apply to students that have
been assigned to Scenario C by the instructor. You can find your scenario assignment in the Final Project Review and Scenario Assignments item in the Module One area of the course. Reach out to your instructor if you have questions about your scenario assignment. If you run into issues and would like to start over with a clean copy of the provided script file (e.g., Milestone1.py), you can click on the gear button, and select Restore current files from the drop-down menu.
Imagine you are a quantitative analyst working in an investment fund that is looking to invest in an agricultural companies that is involved in rice production. Your primary job is to analyze the production levels of four candidate companies. Your analysis will help identify companies with rice production levels that are significantly different than others. This will help your fund make a data based decision on their investment.
You are now given a task to analyze historical data on rice production for four agricultural companies. The data consist of monthly rice production in cwt (Centum Weight - measure of weight) for four companies for the past 21 years. You will be using this data to finish this task.
Use the following table as a reference guide for the variables of interest for this project.
| Variable | Definition |
|---|---|
| Company1 | Total rice production, in cwt, for Company 1. |
| Company2 | Total rice production, in cwt, for Company 2. |
| Company3 | Total rice production, in cwt, for Company 3. |
| Company4 | Total rice production, in cwt, for Company 4. |
| Month | The Month of the year reported as integers (1, 2, 3, 4, 5, 6, 7, 8, 9, 10, 11, 12). |
Step 1: Import your data set
You will be working with the Rice Production data set. To ensure that you analyze the correct data set, make the following edits to the function underneath Step 1: Import your data set in the Tool Panel on the left side of the screen.
Uncomment line 11 Replace '???FILE_NAME???' with 'Rice_Production.csv' Replace ???DATASET_NAME??? with production
Step 2: Calculate descriptive statistics for rice production in Company 1 (Company1)
You will need to calculate the following descriptive statistics for the variable Company1:
Mean
Median
Variance
Standard Deviation
Minimum
Maximum
25th Percentile
75th Percentile
In order to perform these functions, you need to make the appropriate modifications to correct Python functions within the provided script. In other words, you should:
Uncomment lines 17 - 52 Replace ???DATASET_NAME??? with production Replace ???VARIABLE_NAME??? with the variable 'Company1'
for each of the required Python functions listed above.
Step 3: Calculate descriptive statistics for rice production in Company 2 (Company2)
You will need to calculate the following descriptive statistics for the variable Company2:
Mean
Median
Variance
Standard Deviation
Minimum
Maximum
25th Percentile
75th Percentile
In order to perform these functions, you need to make the appropriate modifications to associated Python functions listed within the provided script. In other words, you should:
Uncomment lines 56 - 89 Replace ???DATASET_NAME??? with production Replace '???VARIABLE_NAME???' with the variable 'Company2'
Step 4: Construct confidence interval for population proportion
Construct a 99% confidence interval for the proportion of months with rice production above 307200 cwt (Company1>307200.0). In order to perform this function, you need to make the appropriate modifications to the provided script. In other words, you should:
Comment lines 17 - 52 Comment lines 56 - 89 Uncomment lines 94 - 100 Replace ???DATASET_NAME??? with production Replace '???VARIABLE_NAME???' with the variable 'Company1' Replace ???Xvalue??? with the appropriate value
Step 5: Construct confidence interval for population mean
Construct a 95% confidence interval for average rice production. In order to perform this function, you need to make the appropriate modifications to the provided script. In other words, you should:
Uncomment lines 106 - 113 Replace ???DATASET_NAME??? with production
Replace '???VARIABLE_NAME???' with the variable 'Company2'####### Milestone 1 Python Script
Step 6: Perform hypothesis test for population proportion
It is known that 29% of the months have rice production by Company1 above 307200 cwt (company1>307200.0). Is there sufficient evidence to suggest that the proportion is less than 29%? Test at 5% level of significance. In order to perform this function, you need to make the appropriate modifications to the provided script. In other words, you should:
Comment lines 94 - 100 Comment lines 106 - 113 Uncomment lines 119 - 125 Replace ???DATASET_NAME??? with production Replace '???VARIABLE_NAME???' with the variable 'Company1' Replace ???Xvalue??? with the appropriate value Replace ???NULL_VALUE??? with the appropriate value for the null hypothesis Replace '???TEST_TYPE???' with the appropriate alternative hypothesis
Step 7: Perform hypothesis test for population mean It is claimed that average rice production by Company2 is 209,500 cwt (Company2 = 209500.0). Test this claim using a hypothesis test at 1% level of significance. In order to perform this function, you need to make the appropriate modifications to the provided script. In other words, you should:
Uncomment lines 131 - 139 Replace ???DATASET_NAME??? with production Replace '???VARIABLE_NAME???' with the variable 'Company2' Replace ???NULL_VALUE??? with the appropriate value for the null hypothesis
Replace '???TEST_TYPE???' with the appropriate alternative hypothesis
Step 8: Get your results
Once you have confirmed that your code is correct by passing each of the self-assessments, it is time to get the results of your statistical tests. First, you must uncomment all of the lines of your scripting file that are not instructional, as indicated below:
Uncomment lines 17 - 52 Uncomment lines 56 - 89 Uncomment lines 94 - 100 Uncomment lines 106 - 113 Uncomment lines 119 - 125 Uncomment lines 131 - 139
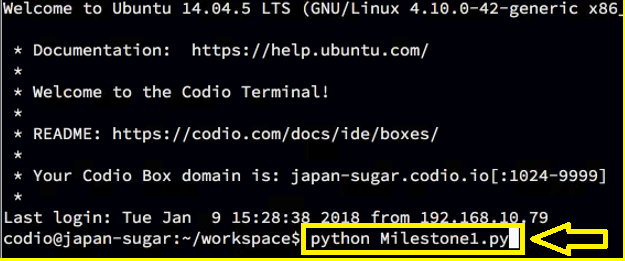
Then, open a new terminal window in which to execute your script.
Finally, insert the command illustrated below and execute the function to see the output of your statistical tests.
Step 9: Submit your Milestone1.py
Now that you have completed all of the above steps for this part of the final project, follow the directions in the rubric document to download and submit your final scripting file to the correct item in Brightspace. Note: Submitting your files to the self-assessment Check Its in Codio is not enough to satisfy the submission requirements for this part of your final project.You must also download and submit a final version of the file to the associated item in Brightspace to earn the points for this assignment.
Step 10: Create Summary Report
Review the prompt in your final project documentation to create your summary report in which you interpret and communicate the results of your statistical analyses in Part I. Follow the directions in your rubric for formatting and submitting this component of your final project.THIS IS THE CODE:import pandas as pdimport scipy.stats as st from snhu_MAT243 import prop_1samp_ztest from snhu_MAT243 import means_1samp_ttest ##Step 1: Import your data set ##----------------------------------------------------------------------------- # ???DATASET_NAME??? = pd.read_csv('???FILENAME???') ##Step 2: Calculate descriptive statistics ##----------------------------------------------------------------------------- # print ('Descriptive Statistics - Step 2') # print ('') # print ('Mean') # print (???DATASET_NAME???[['???VARIABLE_NAME???']].mean()) # print ('') # print ('Median') # print (???DATASET_NAME???[['???VARIABLE_NAME???']].median()) # print ('') # print ('Mode') # print (???DATASET_NAME???[['???VARIABLE_NAME???']].mode()) # print ('') # print ('Minimum') # print (???DATASET_NAME???[['???VARIABLE_NAME???']].min()) # print ('') # print ('Maximum') # print (???DATASET_NAME???[['???VARIABLE_NAME???']].max()) # print ('') # print ('Mean') # print (???DATASET_NAME???[['???VARIABLE_NAME???']].var()) # print ('') # print ('Standard Deviation') # print (???DATASET_NAME???[['???VARIABLE_NAME???']].std()) # print ('') # print ('Describe') # print (???DATASET_NAME???[['???VARIABLE_NAME???']].describe()) # print ('') # print ('') ##Step 3: Calculate descriptive statistics ##----------------------------------------------------------------------------- # print ('Descriptive Statistics - Step 3') # print ('') # print ('Mean') # print (???DATASET_NAME???[['???VARIABLE_NAME???']].mean()) # print ('') # print ('Median') # print (???DATASET_NAME???[['???VARIABLE_NAME???']].median()) # print ('') # print ('Mode') # print (???DATASET_NAME???[['???VARIABLE_NAME???']].mode()) # print ('') # print ('Minimum') # print (???DATASET_NAME???[['???VARIABLE_NAME???']].min()) # print ('') # print ('Maximum') # print (???DATASET_NAME???[['???VARIABLE_NAME???']].max()) # print ('') # print ('Mean') # print (???DATASET_NAME???[['???VARIABLE_NAME???']].var()) # print ('') # print ('Standard Deviation') # print (???DATASET_NAME???[['???VARIABLE_NAME???']].std()) # print ('') # print ('Describe') # print (???DATASET_NAME???[['???VARIABLE_NAME???']].describe()) # print ('') ##Step 4: Construct confidence interval for population proportion ##----------------------------------------------------------------------------- # print ('Confidence Interval - Step 4') # n = ???DATASET_NAME???[['???VARIABLE_NAME???']].count() # x = (???DATASET_NAME???[['???VARIABLE_NAME???']] > ???Xvalue???).values.sum() # p = x*1.0 # stderror = (p * (1 - p))**0.5 # print (st.norm.interval(0.99, p, stderror)) # print ('') ##Step 5: Construct confidence interval for population mean ##----------------------------------------------------------------------------- # print ('Confidence Interval - Step 5') # n = ???DATASET_NAME???[['???VARIABLE_NAME???']].count() # df = n - 1 # mean = ???DATASET_NAME???[['???VARIABLE_NAME???']].mean() # stdev = ???DATASET_NAME???[['???VARIABLE_NAME???']].std() # stderror = stdev/(n**0.5) # print (st.t.interval(0.95, df, mean, stderror)) # print ('') ##Step 6: Perform hypothesis test for population proportion ##----------------------------------------------------------------------------- # print ('Hypothesis Test - Step 6') # n = ???DATASET_NAME???[['???VARIABLE_NAME???']].count() # x = (???DATASET_NAME???[['???VARIABLE_NAME???']] > ???Xvalue???).values.sum() # null_value = ???NULL_VALUE??? # alternative = '???TEST_TYPE???' # print (prop_1samp_ztest(x, n, null_value, alternative)) # print ('') ##Step 7: Perform hypothesis test for population mean ##----------------------------------------------------------------------------- # print ('Hypothesis Test - Step 7') # n = ???DATASET_NAME???[['???VARIABLE_NAME???']].count() # df = n - 1 # mean = ???DATASET_NAME???[['???VARIABLE_NAME???']].mean() # std_dev = ???DATASET_NAME???[['???VARIABLE_NAME???']].std() # null_value = ???NULL_VALUE??? # alternative = '???TEST_TYPE???' # print (means_1samp_ttest(mean, std_dev, n, null_value, alternative)) # print ('')
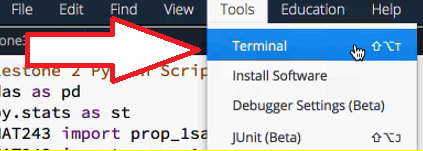
File Edit Find View Tools Education Help one: Terminal estone z PyScr nstall Software as as pd y.stats as st AT243 import prop 1sa JUnit (Beta) Debugger Settings (Beta) File Edit Find View Tools Education Help one: Terminal estone z PyScr nstall Software as as pd y.stats as st AT243 import prop 1sa JUnit (Beta) Debugger Settings (Beta)Step by Step Solution
There are 3 Steps involved in it
Step: 1

Get Instant Access to Expert-Tailored Solutions
See step-by-step solutions with expert insights and AI powered tools for academic success
Step: 2

Step: 3
Ace Your Homework with AI
Get the answers you need in no time with our AI-driven, step-by-step assistance
Get Started
MFDBS 91 3rd Symposium On Mathematical Fundamentals Of Database And Knowledge Base Systems Rostock Germany May 6 9 1991
Authors: Bernhard Thalheim ,Janos Demetrovics ,Hans-Detlef Gerhardt
1991st Edition
3540540091, 978-3540540090