

Answered step by step
Verified Expert Solution
Question
1 Approved Answer
PYTHON coffeetemp.txt 0.0 83.0 1.0 77.7 2.0 75.1 3.0 73.0 4.0 71.1 5.0 69.4 6.0 67.8 7.0 66.4 8.0 64.7 9.0 63.4 10.0 62.1 11.0
PYTHON
coffeetemp.txt
0.0 83.0 1.0 77.7 2.0 75.1 3.0 73.0 4.0 71.1 5.0 69.4 6.0 67.8 7.0 66.4 8.0 64.7 9.0 63.4 10.0 62.1 11.0 61.0 12.0 59.9 13.0 58.7 14.0 57.8 15.0 56.6
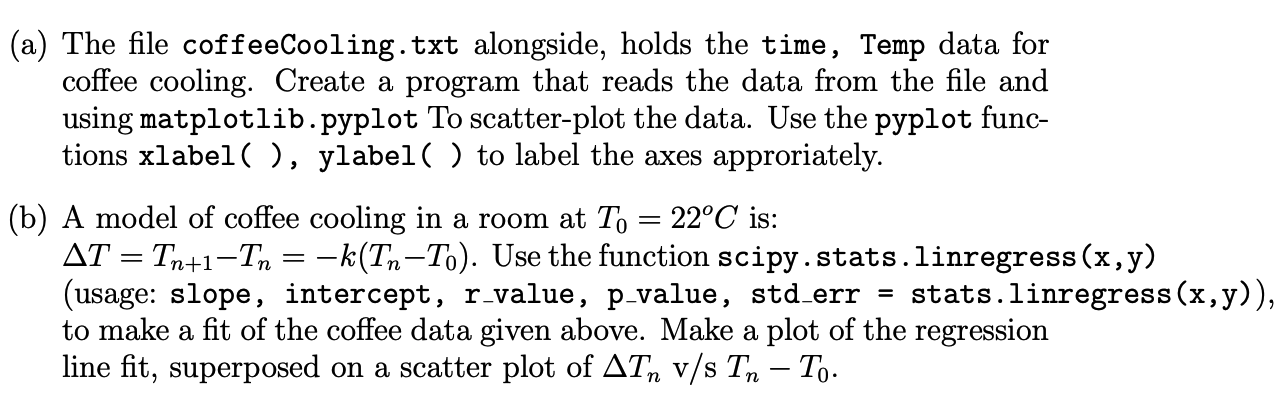
(a) The file coffeeCooling.txt alongside, holds the time, Temp data for coffee cooling. Create a program that reads the data from the file and using matplotlib.pyplot To scatter-plot the data. Use the pyplot func- tions xlabel( ), ylabel( ) to label the axes approriately. (b) A model of coffee cooling in a room at To = 22C is: AT = Tn+1-Tn = -k(In-To). Use the function scipy.stats.linregress(x,y) (usage: slope, intercept, r_value, p-value, std_err = stats.linregress(x,y)), to make a fit of the coffee data given above. Make a plot of the regression line fit, superposed on a scatter plot of ATn v/s Tn To. (a) The file coffeeCooling.txt alongside, holds the time, Temp data for coffee cooling. Create a program that reads the data from the file and using matplotlib.pyplot To scatter-plot the data. Use the pyplot func- tions xlabel( ), ylabel( ) to label the axes approriately. (b) A model of coffee cooling in a room at To = 22C is: AT = Tn+1-Tn = -k(In-To). Use the function scipy.stats.linregress(x,y) (usage: slope, intercept, r_value, p-value, std_err = stats.linregress(x,y)), to make a fit of the coffee data given above. Make a plot of the regression line fit, superposed on a scatter plot of ATn v/s Tn ToStep by Step Solution
There are 3 Steps involved in it
Step: 1

Get Instant Access to Expert-Tailored Solutions
See step-by-step solutions with expert insights and AI powered tools for academic success
Step: 2

Step: 3
Ace Your Homework with AI
Get the answers you need in no time with our AI-driven, step-by-step assistance
Get Started
Sams Teach Yourself Beginning Databases In 24 Hours
Authors: Ryan Stephens, Ron Plew
1st Edition
067232492X, 978-0672324925