

Answered step by step
Verified Expert Solution
Question
1 Approved Answer
python for data science Answer the following questions: B-1. List all the variables shown in Table 1. What is the use of Table 2's data?
python for data science
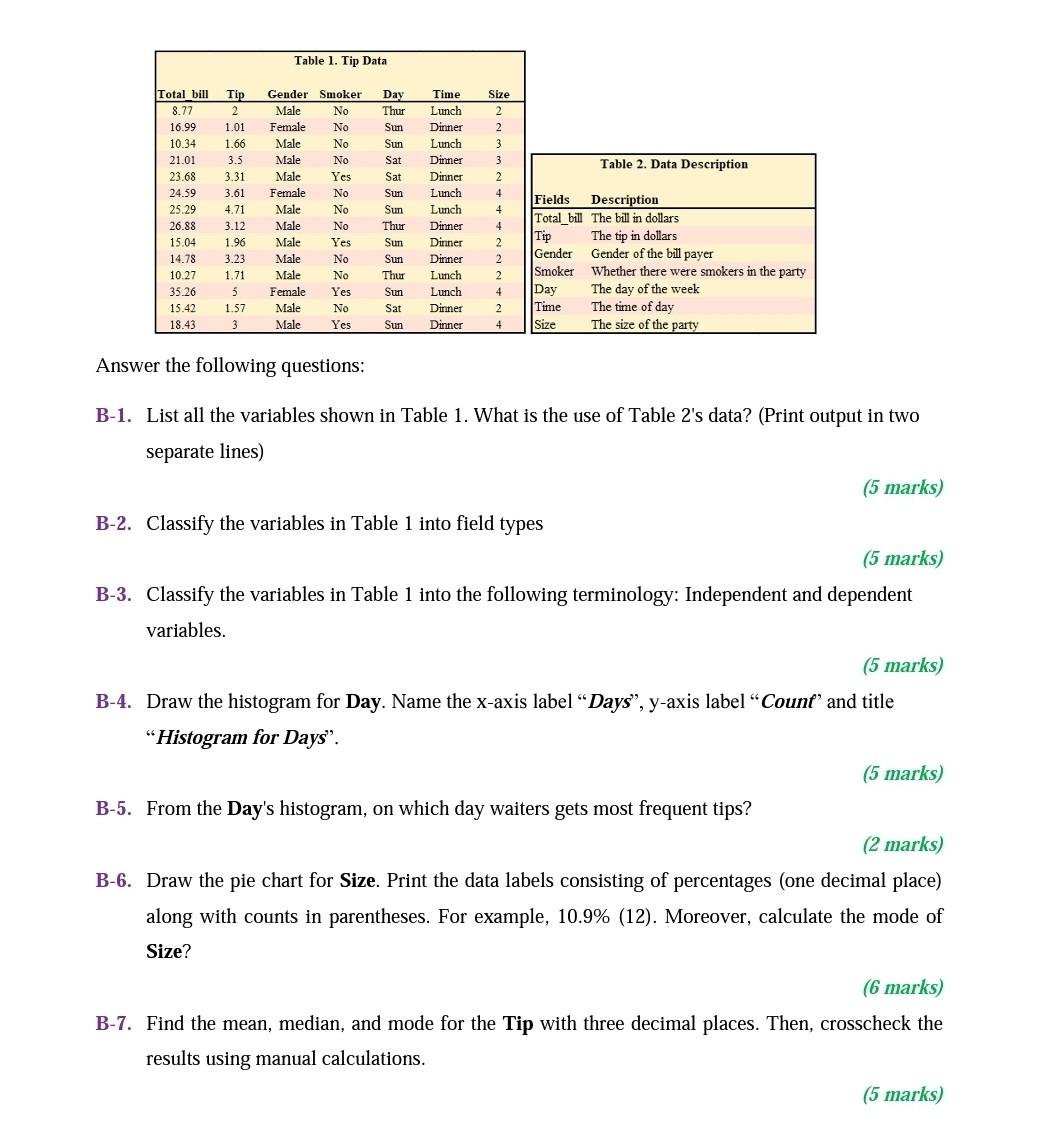
Answer the following questions: B-1. List all the variables shown in Table 1. What is the use of Table 2's data? (Print output in two separate lines) (5 marks) B-2. Classify the variables in Table 1 into field types (5 marks) B-3. Classify the variables in Table 1 into the following terminology: Independent and dependent variables. (5 marks) B-4. Draw the histogram for Day. Name the x-axis label "Days", y-axis label "Counf' and title "Histogram for Days". (5 marks) B-5. From the Day's histogram, on which day waiters gets most frequent tips? (2 marks) B-6. Draw the pie chart for Size. Print the data labels consisting of percentages (one decimal place) along with counts in parentheses. For example, 10.9\% (12). Moreover, calculate the mode of Size? (6 marks) B-7. Find the mean, median, and mode for the Tip with three decimal places. Then, crosscheck the results using manual calculations
Step by Step Solution
There are 3 Steps involved in it
Step: 1

Get Instant Access to Expert-Tailored Solutions
See step-by-step solutions with expert insights and AI powered tools for academic success
Step: 2

Step: 3
Ace Your Homework with AI
Get the answers you need in no time with our AI-driven, step-by-step assistance
Get Started
Structured Search For Big Data From Keywords To Key-objects
Authors: Mikhail Gilula
1st Edition
012804652X, 9780128046524