

Answered step by step
Verified Expert Solution
Question
1 Approved Answer
python language python language Istanbul's monthly dam water level data from 2005 to present is provided in a named Istanbul Water.csy. The data has the
python language 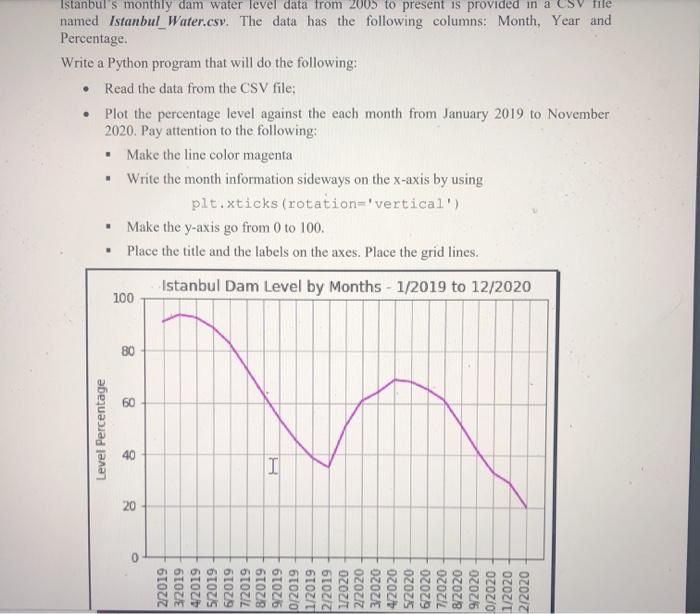
python language
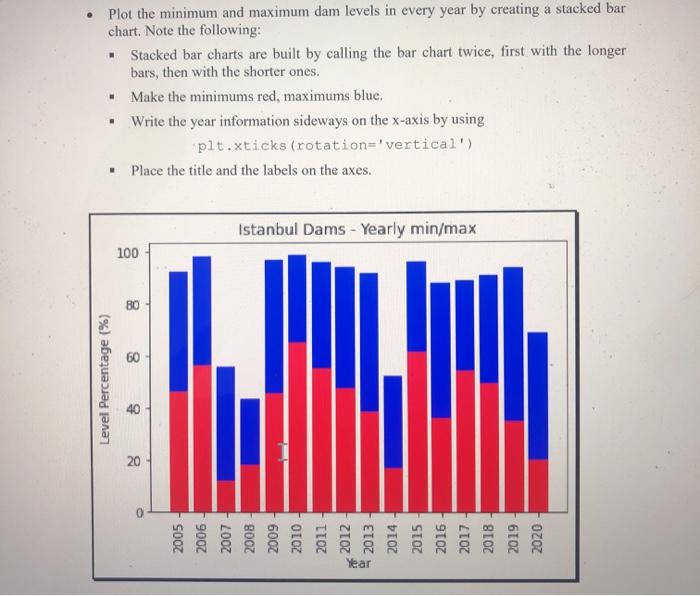
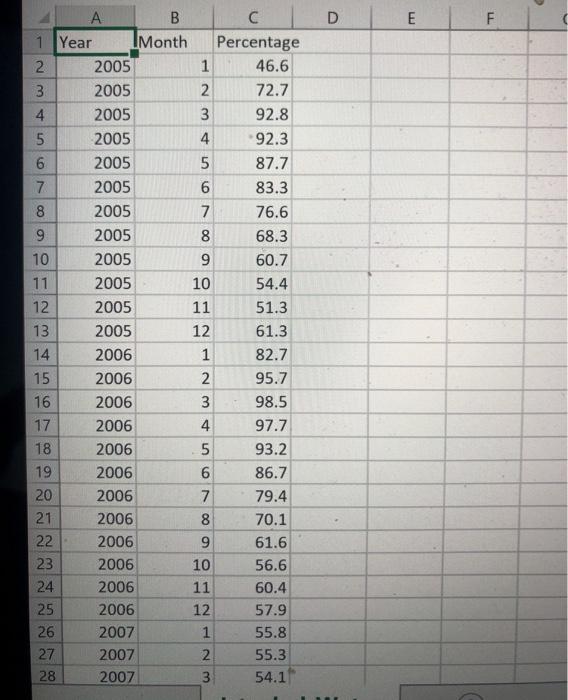
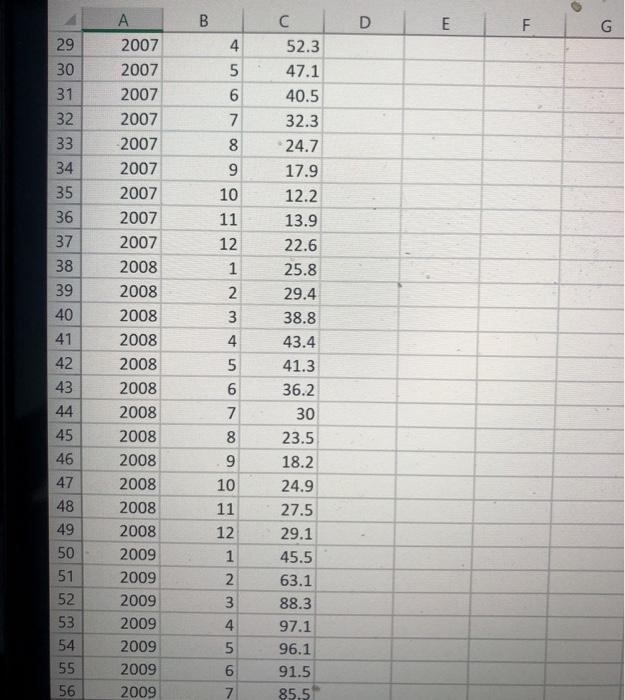
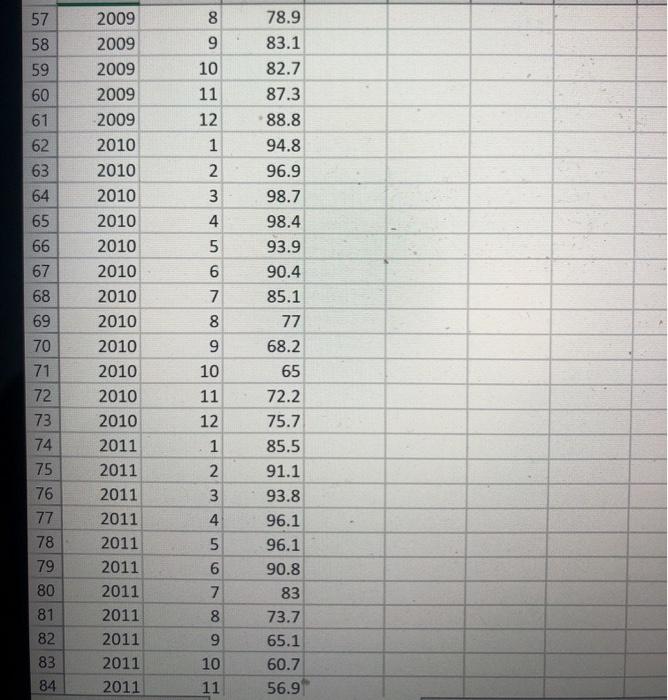
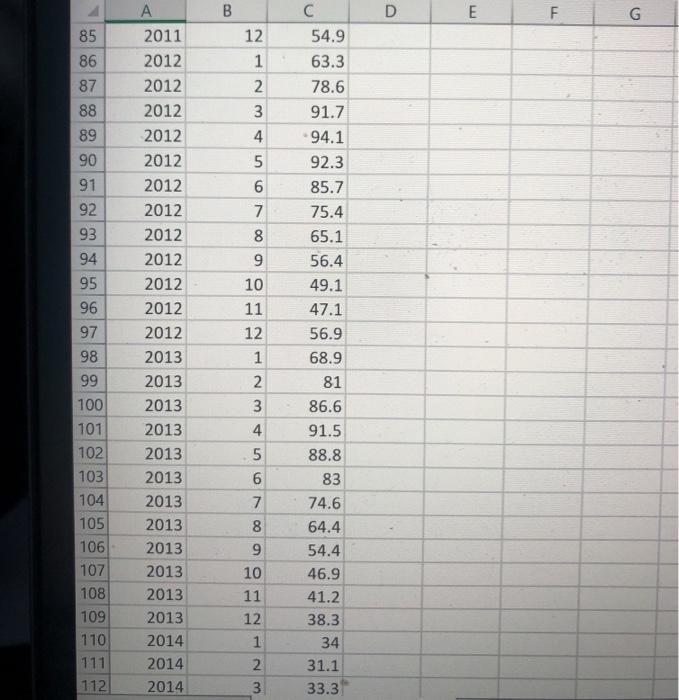
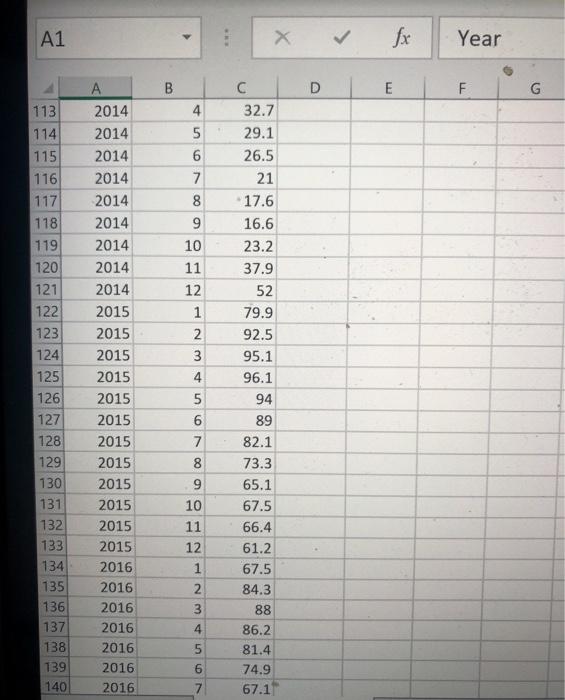
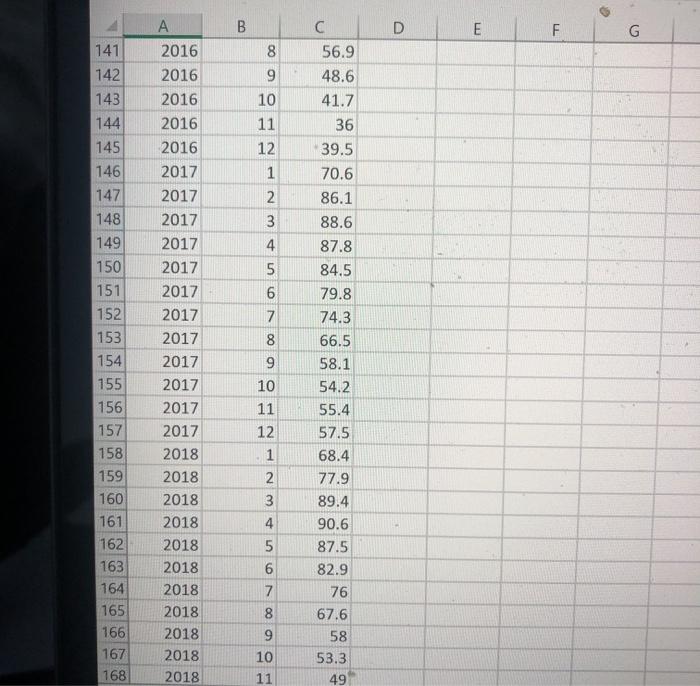
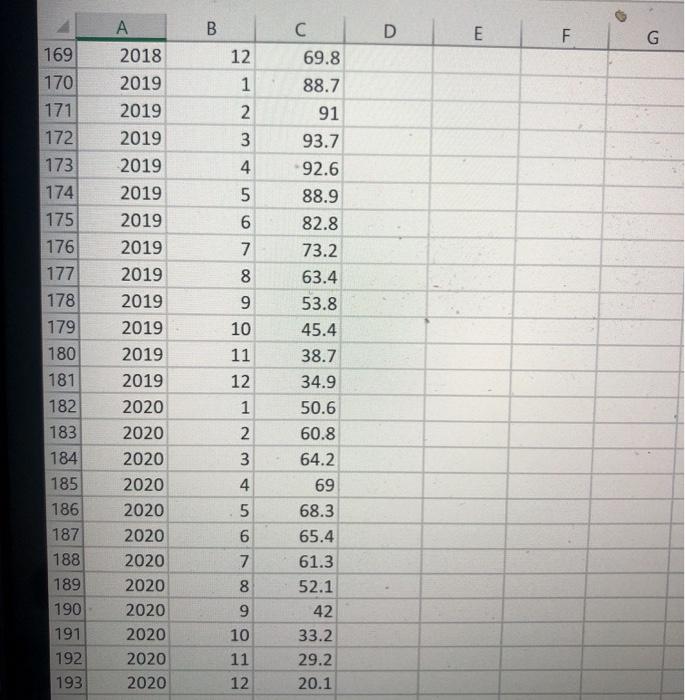
Istanbul's monthly dam water level data from 2005 to present is provided in a named Istanbul Water.csy. The data has the following columns: Month, Year and Percentage Write a Python program that will do the following: Read the data from the CSV file: Plot the percentage level against the each month from January 2019 to November 2020. Pay attention to the following: . Make the line color magenta Write the month information sideways on the x-axis by using plt.xticks (rotation="vertical) Make the y-axis go from 0 to 100. Place the title and the labels on the axes. Place the grid lines. Istanbul Dam Level by Months - 1/2019 to 12/2020 100 80 60 Level Percentage 40 T 20 0 2/2019 3/2019 42019 52019 6/2019 7/2019 8/2019 6TOZI6 10/2019 1/2019 2/2019 1/2020 2/2020 3/2020 42020 5/2020 62020 7/2020 82020 92020 0/2020 1/2020 2/2020 Plot the minimum and maximum dam levels in every year by creating a stacked bar chart. Note the following: Stacked bar charts are built by calling the bar chart twice, first with the longer bars, then with the shorter ones. Make the minimums red, maximums blue, Write the year information sideways on the x-axis by using plt.xticks (rotation='vertical') . Place the title and the labels on the axes. Istanbul Dams - Yearly min/max 100 60 Level Percentage (%) 20 0 2010 2011 2012 Year D E F N 3 5 5 LO B 1 Year I Month 2005 3 2005 4 2005 5 2005 6 2005 7 2005 8 2005 9 2005 10 2005 11 2005 12 2005 13 2005 14 2006 15 2006 16 2006 17 2006 18 2006 19 2006 20 2006 21 2006 22 2006 23 2006 24 2006 25 2006 2007 27 2007 28 2007 C Percentage 1 46.6 2 72.7 3 92.8 4 92.3 5 87.7 6 83.3 7 76.6 8 68.3 9 60.7 10 54.4 11 51.3 12 61.3 1 82.7 2 95.7 3 98.5 4 97.7 5 93.2 6 86.7 7 79.4 8 70.1 9 61.6 10 56.6 11 60.4 12 57.9 1 55.8 2 55.3 3 54.1 2 5 B B D E E F F G 4 5 29 30 31 32 33 34 35 36 37 38 39 40 41 5 6 7 8 9 10 11 12 1 52.3 47.1 40.5 32.3 24.7 17.9 12.2 13.9 22.6 25.8 29.4 38.8 43.4 41.3 36.2 2 3 A 2007 2007 2007 2007 2007 2007 2007 2007 2007 2008 2008 2008 2008 2008 2008 2008 2008 2008 2008 2008 2008 2009 2009 2009 2009 2009 2009 2009 42 4 5 6 7 30 8 9 10 11 43 44 45 46 47 48 49 50 51 52 53 54 55 56 12 23.5 18.2 24.9 27.5 29.1 45.5 63.1 88.3 97.1 96.1 91.5 85.5 1 2 3 4 5 6 7 3 9 57 58 59 60 8 9 10 11 12 1 2 3 4 5 6 61 62 63 64 65 66 67 68 69 70 71 72 73 74 75 76 77 78 79 2009 2009 2009 2009 2009 2010 2010 2010 2010 2010 2010 2010 2010 2010 2010 2010 2010 2011 2011 2011 2011 2011 2011 2011 2011 2011 2011 2011 7 8 9 10 11 12 78.9 83.1 82.7 87.3 88.8 94.8 96.9 98.7 98.4 93.9 90.4 85.1 77 68.2 65 72.2 75.7 85.5 91.1 93.8 96.1 96.1 90.8 83 73.7 65.1 60.7 56.9 2 3 1 2 3 80 4 5 6 7 8 9 10 11 81 82 83 84 00 B D E F G 85 86 87 88 89 90 91 92 93 94 95 96 97 98 99 100 101 102 103 104 105 106 107 108 109 110 111 112 2011 2012 2012 2012 2012 2012 2012 2012 2012 2012 2012 2012 2012 2013 2013 2013 2013 2013 2013 2013 2013 2013 2013 2013 2013 2014 2014 2014 12. 1 2 3 4 5 6 7 8 9 10 11 12 1 1 C 54.9 63.3 78.6 91.7 94.1 92.3 85.7 75.4 65.1 56.4 49.1 47.1 56.9 68.9 81 86.6 91.5 88.8 83 74.6 64.4 54.4 46.9 41.2 38.3 34 31.1 33.3 N 3 4 5 6 5 7 8 9 10 11 12 1 2 3 A1 > : Year B D E F G 113 114 115 116 117 118 119 120 121 122 123 124 125 126 127 128 129 130 131 132 133 134 135 136 137 138 139 140 3 2014 2014 2014 2014 2014 2014 2014 2014 2014 2015 2015 2015 2015 2015 2015 2015 2015 2015 2015 2015 2015 2016 2016 2016 2016 2016 2016 2016 4 5 6 7 8 9 10 11 12 1 2 3 4 5 6 7 8 9 10 11 12 1 2 C 32.7 29.1 26.5 21 17.6 16.6 23.2 37.9 52 79.9 92.5 95.1 96.1 94 89 82.1 73.3 65.1 67.5 66.4 61.2 67.5 84.3 88 86.2 81.4 74.9 67.1 5 3 4 5 6 7 B B D E F G 141 8 C 56.9 48.6 41.7 142 36 9 10 11 12 1 2 3 4 5 6 A 2016 2016 2016 2016 2016 2017 2017 2017 2017 2017 2017 2017 2017 2017 2017 2017 2017 2018 2018 2018 2018 2018 2018 2018 2018 2018 2018 2018 143 144 145 146 147 148 149 150 151 152 153 154 155 156 157 158 159 160 161 162 163 164 165 166 167 168 7 8 9 10 11 12 1 39.5 70.6 86.1 88.6 87.8 84.5 79.8 74.3 66.5 58.1 54.2 55.4 57.5 68.4 77.9 89.4 90.6 87.5 82.9 76 67.6 58 53.3 49 2 3 4 5 6 5 6 7 8 9 9 10 11 2 B B D E C 69.8 F G 12 1 2 3 3 4 5 6 7 169 170 171 172 173 174 175 176 177 178 179 180 181 182 183 184 8 A 2018 2019 2019 2019 2019 2019 2019 2019 2019 2019 2019 2019 2019 2020 2020 2020 2020 2020 2020 2020 2020 2020 2020 2020 2020 9 10 11 12 88.7 91 93.7 92.6 88.9 82.8 73.2 63.4 53.8 45.4 38.7 34.9 50.6 60.8 64.2 69 68.3 65.4 61.3 52.1 42 33.2 29.2 20.1 1 2 185 3 4 5 6 186 187 188 6 7 00 9 189 190 191 192 193 10 11 12 Step by Step Solution
There are 3 Steps involved in it
Step: 1

Get Instant Access to Expert-Tailored Solutions
See step-by-step solutions with expert insights and AI powered tools for academic success
Step: 2

Step: 3
Ace Your Homework with AI
Get the answers you need in no time with our AI-driven, step-by-step assistance
Get Started
Oracle Database 11g SQL
Authors: Jason Price
1st Edition
0071498508, 978-0071498500