

Answered step by step
Verified Expert Solution
Question
1 Approved Answer
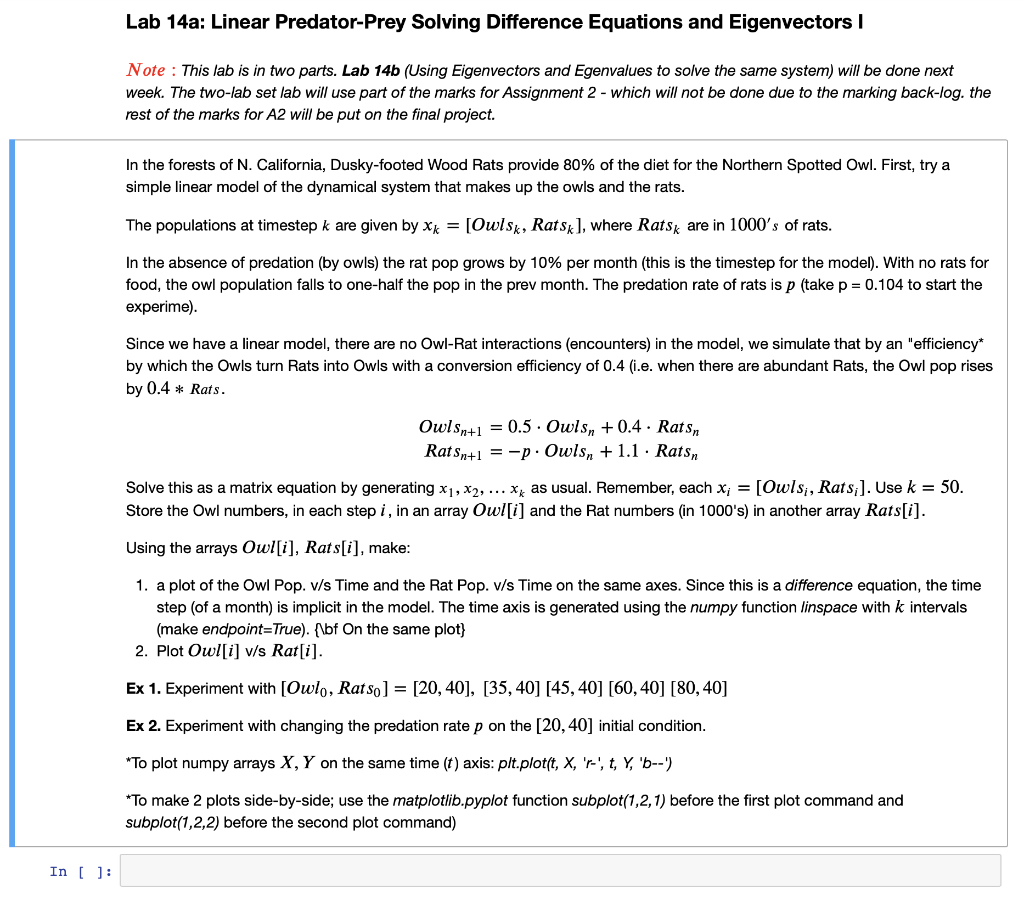
PYTHON PYTHON Do not copy others, they're wrong Lab 14a: Linear Predator-Prey Solving Difference Equations and Eigenvectors I Note : This lab is in two
 PYTHON PYTHON
Do not copy others, they're wrong
Lab 14a: Linear Predator-Prey Solving Difference Equations and Eigenvectors I Note : This lab is in two parts. Lab 14b (Using Eigenvectors and Egenvalues to solve the same system) will be done next week. The two-lab set lab will use part of the marks for Assignment 2 - which will not be done due to the marking back-log. the rest of the marks for A2 will be put on the final project. In the forests of N. California, Dusky-footed Wood Rats provide 80% of the diet for the Northern Spotted Owl. First, try a simple linear model of the dynamical system that makes up the owls and the rats. The populations at timestep k are given by xk=[Owlsk, Rats k], where Rats k are in 1000s of rats. In the absence of predation (by owls) the rat pop grows by 10% per month (this is the timestep for the model). With no rats for food, the owl population falls to one-half the pop in the prev month. The predation rate of rats is p (take p=0.104 to start the experime). Since we have a linear model, there are no Owl-Rat interactions (encounters) in the model, we simulate that by an "efficiency* by which the Owls turn Rats into Owls with a conversion efficiency of 0.4 (i.e. when there are abundant Rats, the Owl pop rises by 0.4 Rats. Owlsn+1Ratn+1=0.5Owlsn+0.4Ratn=pOwlsn+1.1Ratsn Solve this as a matrix equation by generating x1,x2,xk as usual. Remember, each xi=[ Owls, Rats si]. Use k=50. Store the Owl numbers, in each step i, in an array Owl[i] and the Rat numbers (in 1000's) in another array Rats [i]. Using the arrays Owl[i], Rats [i], make: 1. a plot of the Owl Pop. v/s Time and the Rat Pop. v/s Time on the same axes. Since this is a difference equation, the time step (of a month) is implicit in the model. The time axis is generated using the numpy function linspace with k intervals (make endpoint=True). \{bf On the same plot\} 2. Plot Owl[i]v/sRat[i]. Ex 1. Experiment with [Owl0,Rats0]=[20,40],[35,40][45,40][60,40][80,40] Ex 2. Experiment with changing the predation rate p on the [20,40] initial condition. "To plot numpy arrays X,Y on the same time (t) axis: plt.plot( (, X,r ' ,t,Y,b '-' ) *To make 2 plots side-by-side; use the matplotlib.pyplot function subplot (1,2,1) before the first plot command and subplot (1,2,2) before the second plot command)Step by Step Solution
There are 3 Steps involved in it
Step: 1

Get Instant Access to Expert-Tailored Solutions
See step-by-step solutions with expert insights and AI powered tools for academic success
Step: 2

Step: 3
Ace Your Homework with AI
Get the answers you need in no time with our AI-driven, step-by-step assistance
Get Started
Harness The Power Of Big Data The IBM Big Data Platform
Authors: Paul Zikopoulos, David Corrigan James Giles Thomas Deutsch Krishnan Parasuraman Dirk DeRoos Paul Zikopoulos
1st Edition
0071808183, 9780071808187