

Question
Python Question: #1: The below carprices.txt contains a single column of car prices in 1000's. Read this data into your program. The first line is
Python Question:
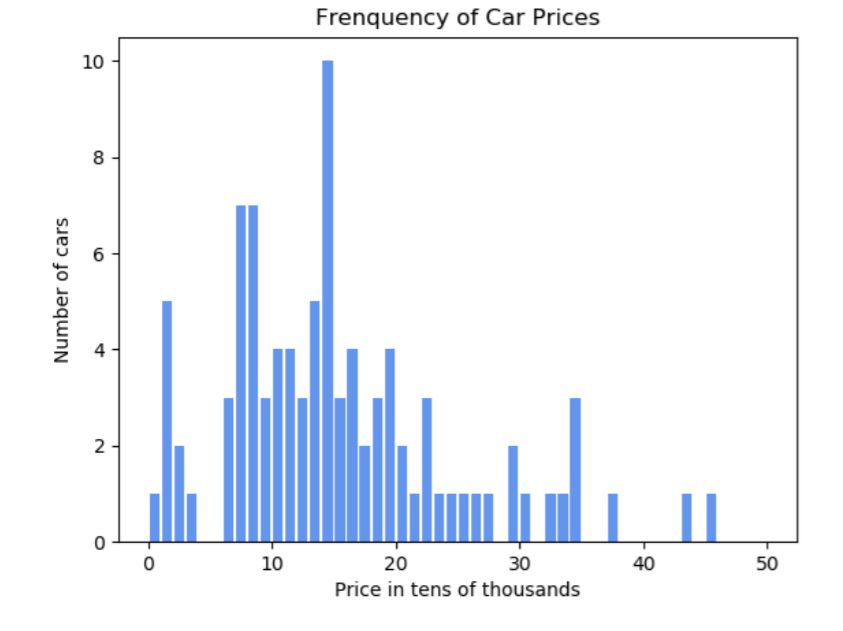
#1: The below carprices.txt contains a single column of car prices in 1000's. Read this data into your program. The first line is the heading and should be ignored. For any line containing non-numeric data, raise a ValueError exception and print a message saying 'This data is invalid and will be ignored' together with the exception object. You should divide each number by 10 and round it down to the nearest integer. Then plot a histogram that looks like the one shown below. The number of bins to use is 50.
Data in carprices.txt:
Min Price
9
13
13
14
17
18
21
29
33
67
68
69
73
73
74
77
78
79
79
82
84
sb
84
84
85
87
87
91
92
94
104
105
108
109
114
114
115
119
124
128
129
133
134
134
136
gg
138
142
142
142
143
145
145
147
147
148
149
152
154
156
163
166
166
167
175
176
184
185
189
194
195
ll
195
199
201
203
218
224
226
229
237
248
259
263
275
292
295
308
325
333
344
346
df
347
375
438
454
Graph:
Step by Step Solution
There are 3 Steps involved in it
Step: 1

Get Instant Access to Expert-Tailored Solutions
See step-by-step solutions with expert insights and AI powered tools for academic success
Step: 2

Step: 3
Ace Your Homework with AI
Get the answers you need in no time with our AI-driven, step-by-step assistance
Get Started
Financial management theory and practice
Authors: Eugene F. Brigham and Michael C. Ehrhardt
12th Edition
978-0030243998, 30243998, 324422695, 978-0324422696