

Answered step by step
Verified Expert Solution
Question
1 Approved Answer
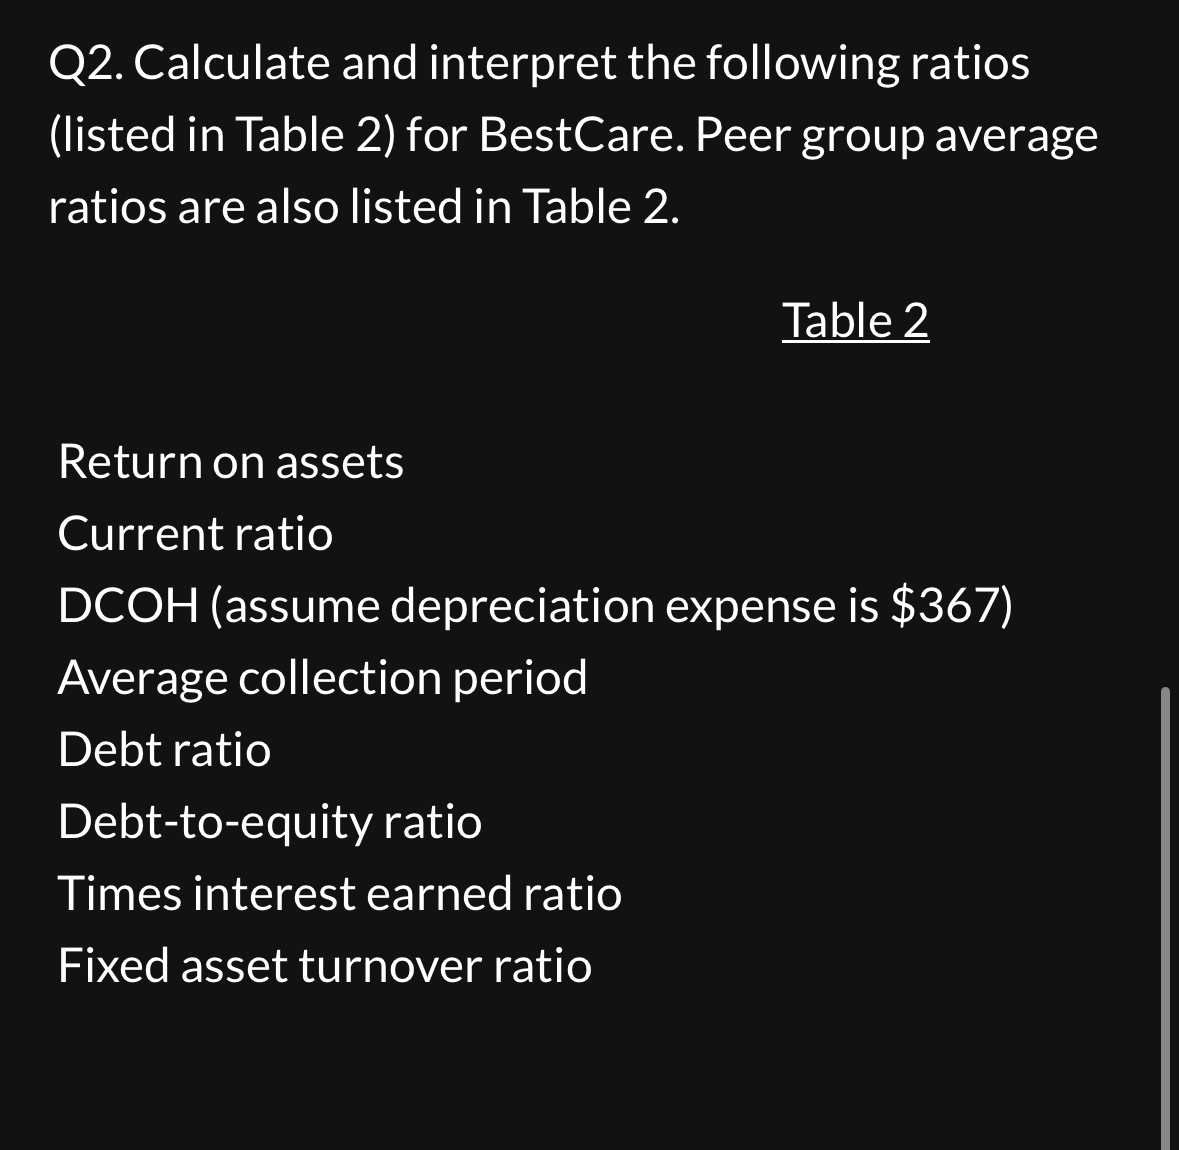
Q 2 . Calculate and interpret the following ratios ( listed in Table 2 ) for BestCare. Peer group average ratios are also listed in
Q Calculate and interpret the following ratios listed in Table for BestCare. Peer group average ratios are also listed in Table Table Peer Group AverageReturn on assetsCurrent ratioDCOH assume depreciation expense is $ days Average collection period daysDebt ratioDebttoequity ratioTimes interest earned ratioFixed asset turnover ratioQ Calculate and interpret the following ratios listed in Table for BestCare. Peer group average ratios are also listed in Table
Table
Return on assets
Current ratio
DCOH assume depreciation expense is $
Average collection period
Debt ratio
Debttoequity ratio
Times interest earned ratio
Fixed asset turnover ratio
Step by Step Solution
There are 3 Steps involved in it
Step: 1

Get Instant Access to Expert-Tailored Solutions
See step-by-step solutions with expert insights and AI powered tools for academic success
Step: 2

Step: 3
Ace Your Homework with AI
Get the answers you need in no time with our AI-driven, step-by-step assistance
Get Started
Sport Funding And Finance
Authors: Bob Stewart
2nd Edition
041583984X, 978-0415839846