

Question
Q 8. The pie-chart given above shows the annual global market share of Pepsi and Coke for the last five years on average. Under what
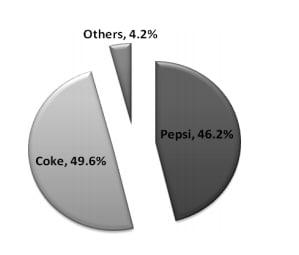
Q 8. The pie-chart given above shows the annual global market share of Pepsi and Coke for the last five years on average. Under what market structure do Pepsi and Coke operate? What microeconomic model can best describe the behavior of Pepsi and Coke? Explain the main theme of this model. Given the obvious market share of both Pepsi and Coke, on what grounds would you justify the multibillion-dollar annual advertising spending by those two companies?
Step by Step Solution
There are 3 Steps involved in it
Step: 1

Get Instant Access to Expert-Tailored Solutions
See step-by-step solutions with expert insights and AI powered tools for academic success
Step: 2

Step: 3
Ace Your Homework with AI
Get the answers you need in no time with our AI-driven, step-by-step assistance
Get Started
Management Accounting And Strategic Human Resource Management
Authors: John Innes, Reza Kouhy
1st Edition
1859714862, 978-1859714867