

Answered step by step
Verified Expert Solution
Question
1 Approved Answer
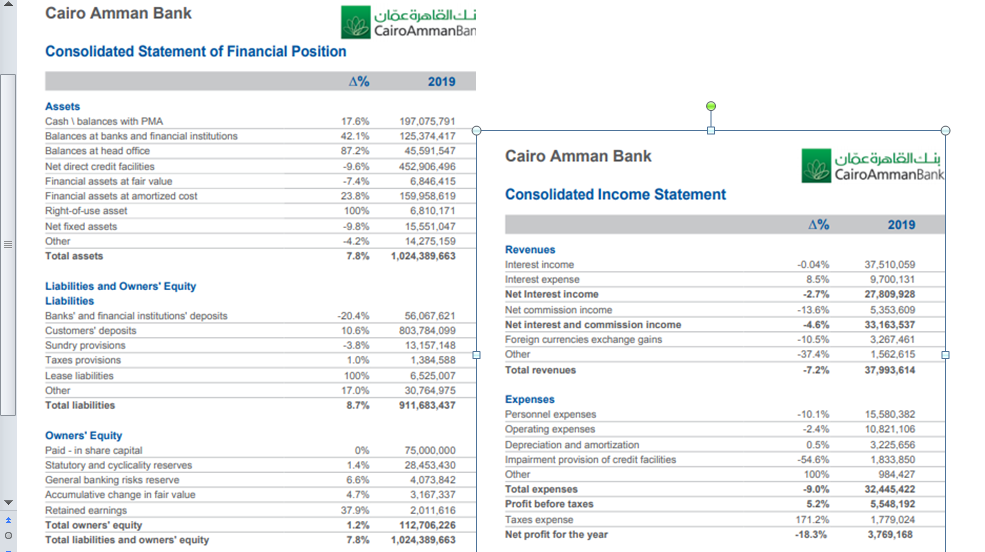
Q: Based on the following financial statements, how Cairo Amman Bank can improve its Return on Assets (ROA), since its equal to .4%? Cairo Amman
Q: Based on the following financial statements, how Cairo Amman Bank can improve its Return on Assets (ROA), since its equal to .4%?
Step by Step Solution
There are 3 Steps involved in it
Step: 1

Get Instant Access to Expert-Tailored Solutions
See step-by-step solutions with expert insights and AI powered tools for academic success
Step: 2

Step: 3
Ace Your Homework with AI
Get the answers you need in no time with our AI-driven, step-by-step assistance
Get Started
Trillions How A Band Of Wall Street Renegades Invented The Index Fund And Changed Finance Forever
Authors: Robin Wigglesworth
1st Edition
0593087682,0593087690