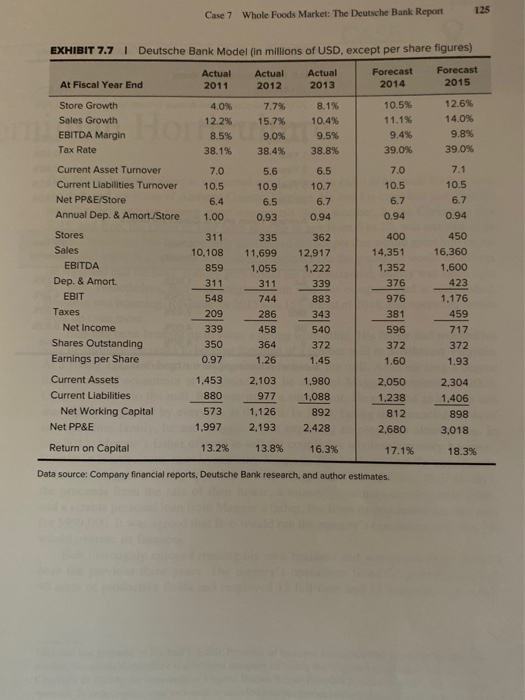
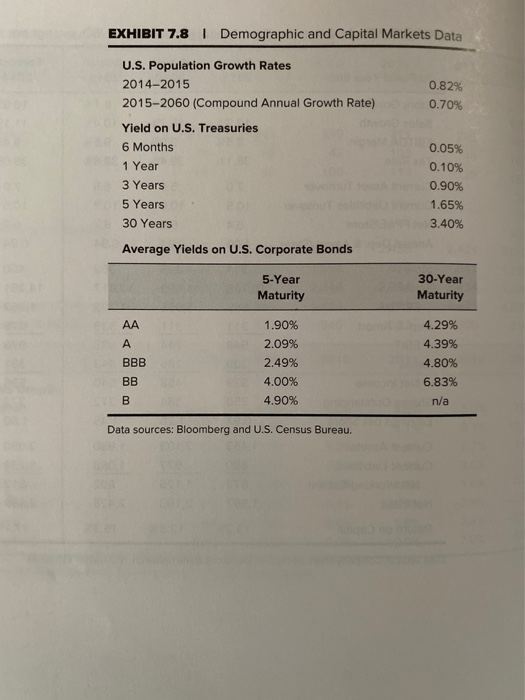
Q: Estimate an intrinsic value of Whole Foods stock based on an EBITDA multiples approach. ( Whole Foods Market: The Deutsche Bank Report)
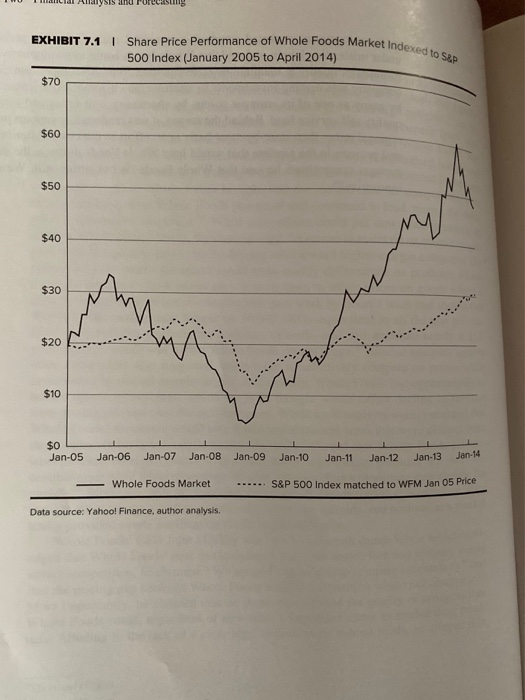
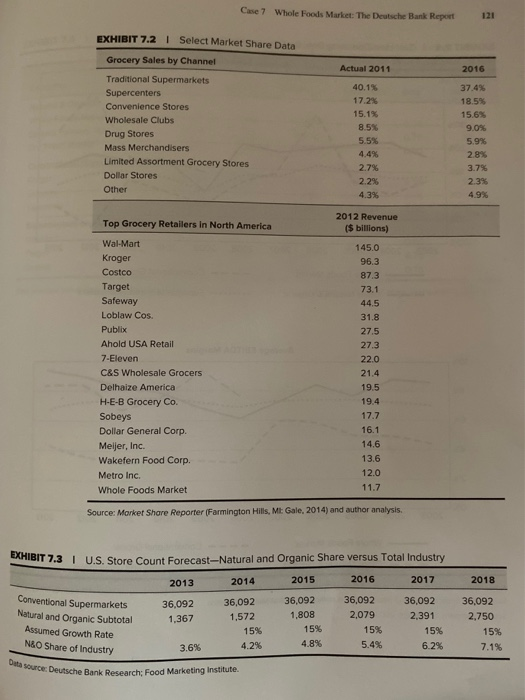
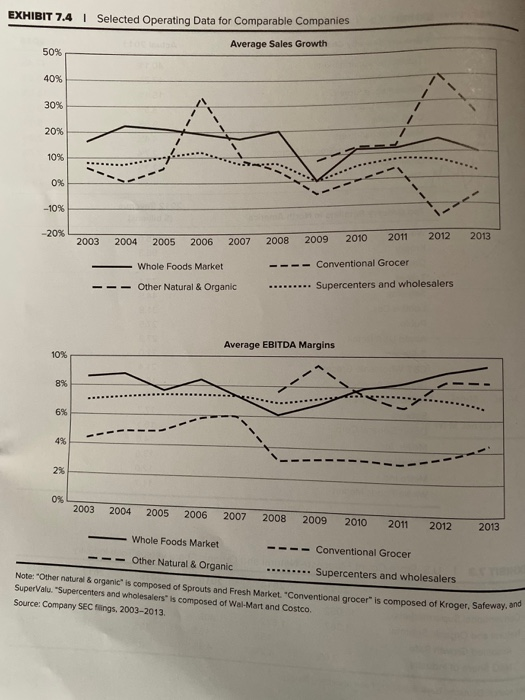
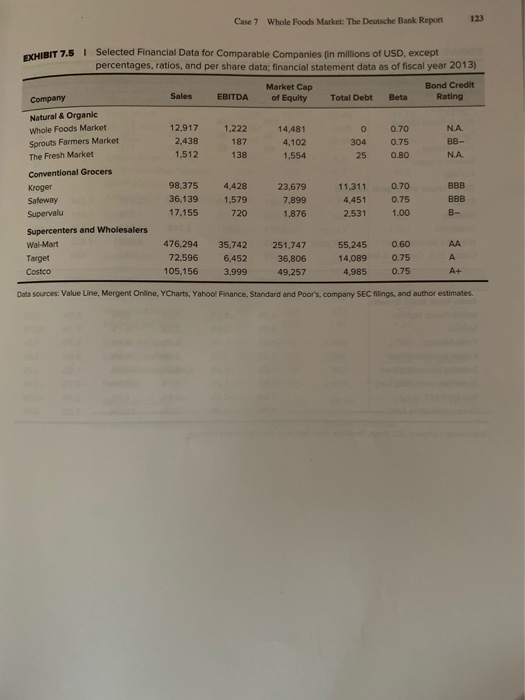
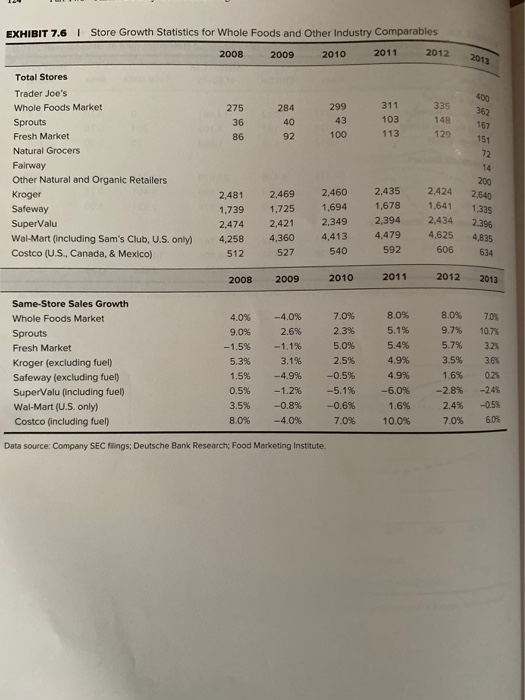
HILTON SE PUTERNI EXHIBIT 7.4 arket Indexed to S&P Share Price Performance of Whole Foods Market Inde! 500 Index (January 2005 to April 2014) 520 $0 Jan-05 Jan-06 Jan-07 Jan 08 Jan 09 Jan-10 Jan 11 Jan 12 Jan 13 Jan 14 Whole Foods Market S&P 500 Index matched to WFM Jan 05 Price Data source: Yahool Finance, author analysis. Case 7 Whole Foods Market: The Deutsche Bank Report 121 EXHIBIT 7.2 | Select Market Share Data Actual 2011 2016 Grocery Sales by Channel Traditional Supermarkets Supercenters Convenience Stores Wholesale Clubs Drug Stores Mass Merchandisers Limited Assortment Grocery Stores Dollar Stores Other 40.1% 17.2% 15.1% 8.5% 5.5% 44% 2.7% 2.23 4.3% 37.4% 18.5% 15.6% 9.0% 5.9% 2.8% 3.7% 2.3% 4.9% Top Grocery Retailers in North America 2012 Revenue ($ billions) Wal-Mart Kroger Costco Target Safeway Loblaw Cos. Publix Ahold USA Retail 7-Eleven C&S Wholesale Grocers Delhaize America H-E-B Grocery Co. Sobeys Dollar General Corp. Meijer, Inc. Wakefern Food Corp. Metro Inc. Whole Foods Market 145.0 96.3 87.3 73.1 44.5 31.8 27.5 27.3 22.0 21.4 19.5 19.4 17.7 16.1 14.6 13.6 12.0 11.7 Source: Market Share Reporter (Farmington Hills, MI: Gale, 2014) and author analysis. 2018 EXHIBIT 7.3 MIBIT 7.3 | U.S. Store Count Forecast-Natural and Organic Share versus Total Industry 2013 2014 2015 2016 conventional Supermarkets 36.092 36,092 36,092 36,092 36,092 Natural and Organic Subtotal 1,367 1,572 1,808 2,079 2.391 15% 15% 15% 15% 3.6% 4.2% 4.8% 5.4% 6.2% 36,092 2,750 15% 7.1% Assumed Growth Rate NGO Share of Industry Dita source: Deutsche ource: Deutsche Bank Research: Food Marketing Institute. EXHIBIT 7.4 | Selected Operating Data for Comparable Companies Average Sales Growth 2003 2004 2005 2006 2007 2008 2009 2010 2011 2012 2013 - Whole Foods Market - Other Natural & Organic ---- Conventional Grocer ......... Supercenters and wholesalers -- Average EBITDA Margins 2003 2004 2005 2006 2007 2008 2009 2010 2011 2012 2013 Whole Foods Market ---- Conventional Grocer --- Other Natural & Organic . .. Supercenters and wholesalers Note Other natura organic" is composed of Sprouts and Fresh Market. "Conventional grocer" is composed of Krogers SuperValu. "Supercenters and wholesalers is composed of Wal-Mart and Costco. Source: Company SEC filings, 2003-2013 Case 7 Whole Foods Market: The Deutsche Bank Report 123 XHIBIT 7.5 | Selected Financial Data for Comparable Companies in millions of USD, except percentages, ratios, and per share data: financial statement data as of fiscal year 2013) Market Cap of Equity Bond Credit Rating Sales EBITDA Total Debt Beta Company Natural & Organic Whole Foods Market Sprouts Farmers Market The Fresh Market Conventional Grocers Kroger Safeway Supervalu 12,917 2,438 1.512 1.222 187 138 14,481 4,102 1,554 0 304 25 0.70 0.75 0.80 NA BB- NA 98.375 36,139 17.155 4,428 1.579 720 23,679 7.899 1.876 11,311 4,451 2.531 0.70 0.75 1.00 BBB BBB AA Supercenters and Wholesalers Wal-Mart Target Costco 476,294 72,596 105,156 35,742 6.452 3,999 251,747 3 6,806 49,257 55,245 14,089 4,985 0.60 0.75 0.75 A At Data sources: Value Line, Mergent Online, YCharts, Yahoo! Finance, Standard and Poor's, company SEC filings, and author estimates. 148 EXHIBIT 7.6 | Store Growth Statistics for Whole Foods and Other Industry Comparables 2008 2009 2010 2011 2012 Total Stores Trader Joe's Whole Foods Market Sprouts Fresh Market Natural Grocers Fairway Other Natural and Organic Retailers Kroger 2,481 2,469 2,460 2,435 2.424 Safeway 1.739 1,725 1,694 1,678 SuperValu 2,474 2,421 2,349 2,394 Wal-Mart (including Sam's Club, U.S. only) 4,258 4,360 4,413 4,479 4,625 Costco (U.S., Canada, & Mexico) 512 527 540 592 2640 1.641 2.434 1.335 2:39 4835 634 606 2008 2009 2010 2011 2012 2013 Same-Store Sales Growth Whole Foods Market Sprouts Fresh Market Kroger (excluding fuel) Safeway (excluding fuel) SuperValu (including fuel) Wal-Mart (U.S. only) Costco (including fuel) 4.0% 9.0% -1.5% 5.3% 1.5% 0.5% 3.5% 8.0% -4.0% 2.6% -1.1% 3.1% -4.9% -1.2% -0.8% -4.0% 7.0% 2.3% 5.0% 2.5% -0.5% -5.1% -0.6% 7.0% 8.0% 5.1% 5.4% 4.9% 4.9% -6.0% 1.6% 0.0% 8.0% 9.7% 5.7% 3.5% 1.6% -2.8% 2.4% 70% 70% 10.7% 32% 36% 02 -245 -0.5% 60% Data source Company SEC filings Deutsche Bank Research Food Marketing Institute Case 7 Whole Foods Market: The Deutsche Bank Report 125 39.0% 7.0 1.00 335 EXHIBIT 7.7 Deutsche Bank Model fin millions of USD, except per share figures) Actual Actual Actual Forecast Forecast At Fiscal Year End 2011 2012 2013 2014 2015 Store Growth 4.0% 7.7% 8.1% 10.5% 12.6% Sales Growth 12.2% 15.7% 10.4% 11.1% 14.0% EBITDA Margin 8.5% 9.0% 9.5% 9.4% 9.8% Tax Rate 38.1% 38.4% 38.8% 39.0% Current Asset Turnover 5.6 6.5 7.0 7.1 Current Liabilities Turnover 10.5 10.9 10.7 10.5 10.5 Net PP&E/Store 6.4 6.5 6.7 6.7 6.7 Annual Dep. & Amort./Store 0.93 0.94 0.94 0.94 Stores 311 362 400 450 Sales 10,108 11.699 12,917 14,351 16.360 859 1,055 1.222 1,352 1,600 Dep. & Amort. 311 376 EBIT 548 744 976 1,176 Taxes 209 Net Income 339 458 540 717 Shares Outstanding 350 364 372 372 372 Earnings per Share 0.97 1.26 1.45 1.60 1.93 Current Assets 1,453 2,103 1.980 2,050 2.304 Current Liabilities 880 977 1,088 1.238 1,406 Net Working Capital 573 1,126 892 812 898 Net PP&E 1,997 2,193 2,428 2.680 3,018 Return on Capital 13.2% 13.8% 16.3% 17.1% 18.3% EBITDA 311 423 339 883 343 286 459 Data source: Company financial reports, Deutsche Bank research, and author estimates. EXHIBIT 7.8 | Demographic and Capital Markets Data 0.82% 0.70% U.S. Population Growth Rates 2014-2015 2015-2060 (Compound Annual Growth Rate) Yield on U.S. Treasuries 6 Months 1 Year 3 Years 5 Years 30 Years Average Yields on U.S. Corporate Bonds 0.05% 0.10% 0.90% 1.65% 3.40% 5-Year Maturity 30-Year Maturity A BBB 1.90% 2.09% 2.49% 4.00% 4.90% 4.29% 4.39% 4.80% 6.83% n/a BB B Data sources: Bloomberg and U.S. Census Bureau. HILTON SE PUTERNI EXHIBIT 7.4 arket Indexed to S&P Share Price Performance of Whole Foods Market Inde! 500 Index (January 2005 to April 2014) 520 $0 Jan-05 Jan-06 Jan-07 Jan 08 Jan 09 Jan-10 Jan 11 Jan 12 Jan 13 Jan 14 Whole Foods Market S&P 500 Index matched to WFM Jan 05 Price Data source: Yahool Finance, author analysis. Case 7 Whole Foods Market: The Deutsche Bank Report 121 EXHIBIT 7.2 | Select Market Share Data Actual 2011 2016 Grocery Sales by Channel Traditional Supermarkets Supercenters Convenience Stores Wholesale Clubs Drug Stores Mass Merchandisers Limited Assortment Grocery Stores Dollar Stores Other 40.1% 17.2% 15.1% 8.5% 5.5% 44% 2.7% 2.23 4.3% 37.4% 18.5% 15.6% 9.0% 5.9% 2.8% 3.7% 2.3% 4.9% Top Grocery Retailers in North America 2012 Revenue ($ billions) Wal-Mart Kroger Costco Target Safeway Loblaw Cos. Publix Ahold USA Retail 7-Eleven C&S Wholesale Grocers Delhaize America H-E-B Grocery Co. Sobeys Dollar General Corp. Meijer, Inc. Wakefern Food Corp. Metro Inc. Whole Foods Market 145.0 96.3 87.3 73.1 44.5 31.8 27.5 27.3 22.0 21.4 19.5 19.4 17.7 16.1 14.6 13.6 12.0 11.7 Source: Market Share Reporter (Farmington Hills, MI: Gale, 2014) and author analysis. 2018 EXHIBIT 7.3 MIBIT 7.3 | U.S. Store Count Forecast-Natural and Organic Share versus Total Industry 2013 2014 2015 2016 conventional Supermarkets 36.092 36,092 36,092 36,092 36,092 Natural and Organic Subtotal 1,367 1,572 1,808 2,079 2.391 15% 15% 15% 15% 3.6% 4.2% 4.8% 5.4% 6.2% 36,092 2,750 15% 7.1% Assumed Growth Rate NGO Share of Industry Dita source: Deutsche ource: Deutsche Bank Research: Food Marketing Institute. EXHIBIT 7.4 | Selected Operating Data for Comparable Companies Average Sales Growth 2003 2004 2005 2006 2007 2008 2009 2010 2011 2012 2013 - Whole Foods Market - Other Natural & Organic ---- Conventional Grocer ......... Supercenters and wholesalers -- Average EBITDA Margins 2003 2004 2005 2006 2007 2008 2009 2010 2011 2012 2013 Whole Foods Market ---- Conventional Grocer --- Other Natural & Organic . .. Supercenters and wholesalers Note Other natura organic" is composed of Sprouts and Fresh Market. "Conventional grocer" is composed of Krogers SuperValu. "Supercenters and wholesalers is composed of Wal-Mart and Costco. Source: Company SEC filings, 2003-2013 Case 7 Whole Foods Market: The Deutsche Bank Report 123 XHIBIT 7.5 | Selected Financial Data for Comparable Companies in millions of USD, except percentages, ratios, and per share data: financial statement data as of fiscal year 2013) Market Cap of Equity Bond Credit Rating Sales EBITDA Total Debt Beta Company Natural & Organic Whole Foods Market Sprouts Farmers Market The Fresh Market Conventional Grocers Kroger Safeway Supervalu 12,917 2,438 1.512 1.222 187 138 14,481 4,102 1,554 0 304 25 0.70 0.75 0.80 NA BB- NA 98.375 36,139 17.155 4,428 1.579 720 23,679 7.899 1.876 11,311 4,451 2.531 0.70 0.75 1.00 BBB BBB AA Supercenters and Wholesalers Wal-Mart Target Costco 476,294 72,596 105,156 35,742 6.452 3,999 251,747 3 6,806 49,257 55,245 14,089 4,985 0.60 0.75 0.75 A At Data sources: Value Line, Mergent Online, YCharts, Yahoo! Finance, Standard and Poor's, company SEC filings, and author estimates. 148 EXHIBIT 7.6 | Store Growth Statistics for Whole Foods and Other Industry Comparables 2008 2009 2010 2011 2012 Total Stores Trader Joe's Whole Foods Market Sprouts Fresh Market Natural Grocers Fairway Other Natural and Organic Retailers Kroger 2,481 2,469 2,460 2,435 2.424 Safeway 1.739 1,725 1,694 1,678 SuperValu 2,474 2,421 2,349 2,394 Wal-Mart (including Sam's Club, U.S. only) 4,258 4,360 4,413 4,479 4,625 Costco (U.S., Canada, & Mexico) 512 527 540 592 2640 1.641 2.434 1.335 2:39 4835 634 606 2008 2009 2010 2011 2012 2013 Same-Store Sales Growth Whole Foods Market Sprouts Fresh Market Kroger (excluding fuel) Safeway (excluding fuel) SuperValu (including fuel) Wal-Mart (U.S. only) Costco (including fuel) 4.0% 9.0% -1.5% 5.3% 1.5% 0.5% 3.5% 8.0% -4.0% 2.6% -1.1% 3.1% -4.9% -1.2% -0.8% -4.0% 7.0% 2.3% 5.0% 2.5% -0.5% -5.1% -0.6% 7.0% 8.0% 5.1% 5.4% 4.9% 4.9% -6.0% 1.6% 0.0% 8.0% 9.7% 5.7% 3.5% 1.6% -2.8% 2.4% 70% 70% 10.7% 32% 36% 02 -245 -0.5% 60% Data source Company SEC filings Deutsche Bank Research Food Marketing Institute Case 7 Whole Foods Market: The Deutsche Bank Report 125 39.0% 7.0 1.00 335 EXHIBIT 7.7 Deutsche Bank Model fin millions of USD, except per share figures) Actual Actual Actual Forecast Forecast At Fiscal Year End 2011 2012 2013 2014 2015 Store Growth 4.0% 7.7% 8.1% 10.5% 12.6% Sales Growth 12.2% 15.7% 10.4% 11.1% 14.0% EBITDA Margin 8.5% 9.0% 9.5% 9.4% 9.8% Tax Rate 38.1% 38.4% 38.8% 39.0% Current Asset Turnover 5.6 6.5 7.0 7.1 Current Liabilities Turnover 10.5 10.9 10.7 10.5 10.5 Net PP&E/Store 6.4 6.5 6.7 6.7 6.7 Annual Dep. & Amort./Store 0.93 0.94 0.94 0.94 Stores 311 362 400 450 Sales 10,108 11.699 12,917 14,351 16.360 859 1,055 1.222 1,352 1,600 Dep. & Amort. 311 376 EBIT 548 744 976 1,176 Taxes 209 Net Income 339 458 540 717 Shares Outstanding 350 364 372 372 372 Earnings per Share 0.97 1.26 1.45 1.60 1.93 Current Assets 1,453 2,103 1.980 2,050 2.304 Current Liabilities 880 977 1,088 1.238 1,406 Net Working Capital 573 1,126 892 812 898 Net PP&E 1,997 2,193 2,428 2.680 3,018 Return on Capital 13.2% 13.8% 16.3% 17.1% 18.3% EBITDA 311 423 339 883 343 286 459 Data source: Company financial reports, Deutsche Bank research, and author estimates. EXHIBIT 7.8 | Demographic and Capital Markets Data 0.82% 0.70% U.S. Population Growth Rates 2014-2015 2015-2060 (Compound Annual Growth Rate) Yield on U.S. Treasuries 6 Months 1 Year 3 Years 5 Years 30 Years Average Yields on U.S. Corporate Bonds 0.05% 0.10% 0.90% 1.65% 3.40% 5-Year Maturity 30-Year Maturity A BBB 1.90% 2.09% 2.49% 4.00% 4.90% 4.29% 4.39% 4.80% 6.83% n/a BB B Data sources: Bloomberg and U.S. Census Bureau