

Question
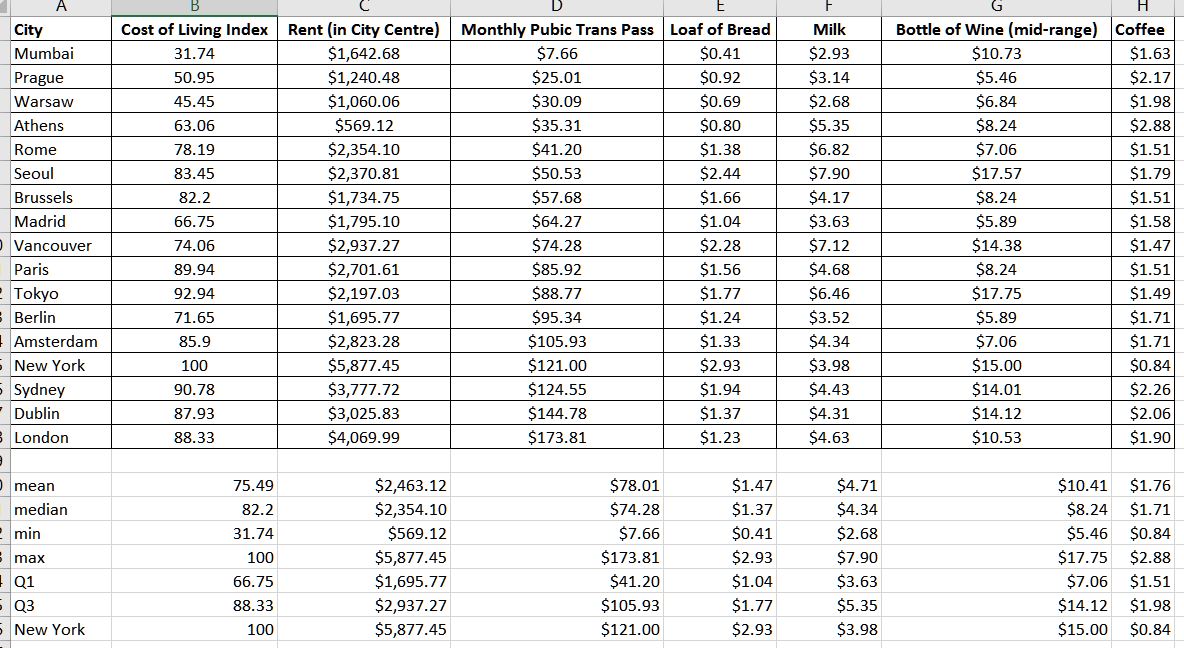
Q) In the Excel document, you will find the 2018 data for 17 cities in the data set Cost of Living. Included are the 2018
Q) In the Excel document, you will find the 2018 data for 17 cities in the data set Cost of Living. Included are the 2018 cost of living index and other common items.All prices are in U.S. dollars.
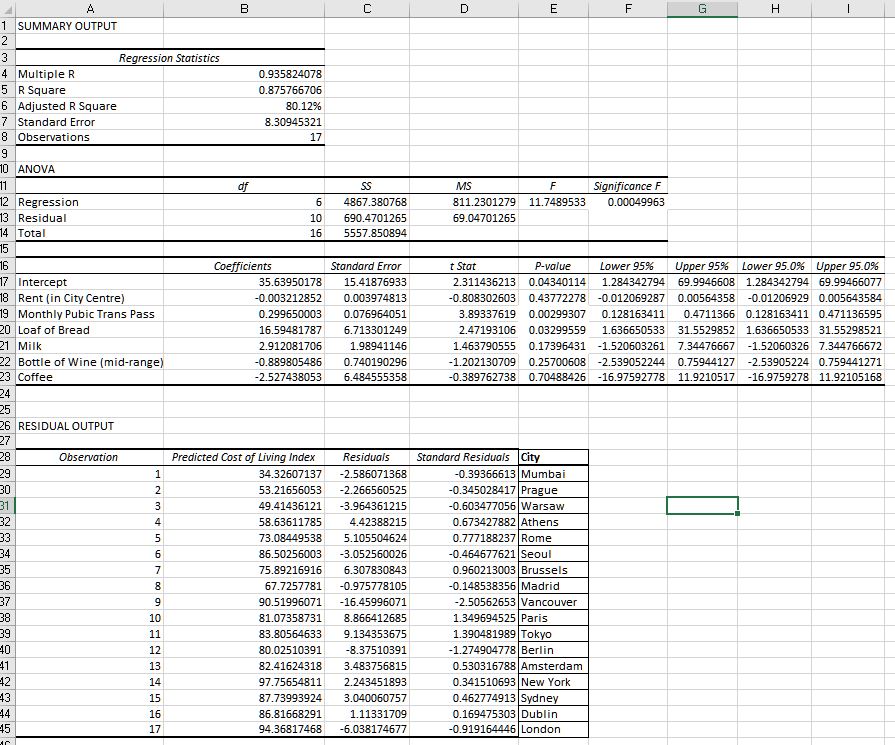
This information was used to run a Multiple Linear Regression to predict Cost of living, along with calculating various descriptive statistics.This is given in the Excel attachment (that is, the MLR has already been calculated.Your task is to interpret the data).
No new calculations, just pick a city to open a second location at and justify the answer based upon the results of the Multiple Linear Regression. Write up the Executive Summary using only the data provided.
1) State significant predictors.
a. You MUST state which predictors are significant at predicting Cost of Living, and how
do you know?
b. Show the comparison to alpha to state your results and conclusion.
c. Do these significant predictors make sense, if you want to relocate?
Example: Based on the MLR results, we can compare the p-values to the alpha. If p-value is less than the alpha (which is 0.05), then the predictor is significant. So, we have the following significant predictors. Monthly public transportation pass, and Loaf of bread.
2) Discuss descriptive statistics for the significant predictors.
a. From the significant predictors, review the mean, median, min, max, Q1 and Q3
values.
b. What city or cities fall above or below the median and/or the mean?
c. What city or cities are in the upper 3rd quartile? Or the bottom quartile?
d. How do these predictors compare to the baseline of NYC? What cost more or
less money than NYC?
3) Recommend at least 2 cities to open a second location in.
a. You MUST use the Significant Predictors AND Descriptive Statistics in your
justification.
b. You must use the excel data to justify your answers. Do not use
any outside resources to justify your answer. Only use Significant Predictors
AND Descriptive Statistics.
Example: London at 88.33, is 11.67% less expensive than NYC. But that doesn't mean London is a good place to open a second location once you discuss the significant predictors and how it relates back to each city.
Example: For the 2nd and 3rd choice we can choose between Tokyo and London. Since they belong to the cities with cost of living above Q3. Tokyo is also above the 3rd quartile in terms of loaf of bread while London is above the 3rd quartile in terms of Monthly public trans pass. However, Tokyo is better for the 2nd choice since it has a higher cost of living index and London is below the median in terms of loaf of bread.
Step by Step Solution
There are 3 Steps involved in it
Step: 1

Get Instant Access to Expert-Tailored Solutions
See step-by-step solutions with expert insights and AI powered tools for academic success
Step: 2

Step: 3
Ace Your Homework with AI
Get the answers you need in no time with our AI-driven, step-by-step assistance
Get Started
Mathematical Applications for the Management Life and Social Sciences
Authors: Ronald J. Harshbarger, James J. Reynolds
11th edition
9781337032247, 9781305465183, 1305108043, 1337032247, 1305465180, 978-1305108042