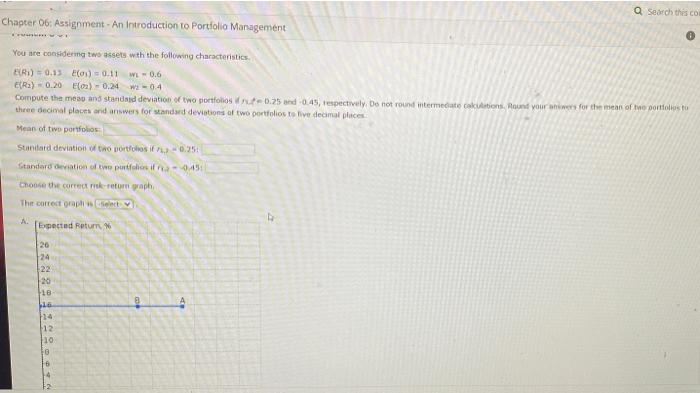
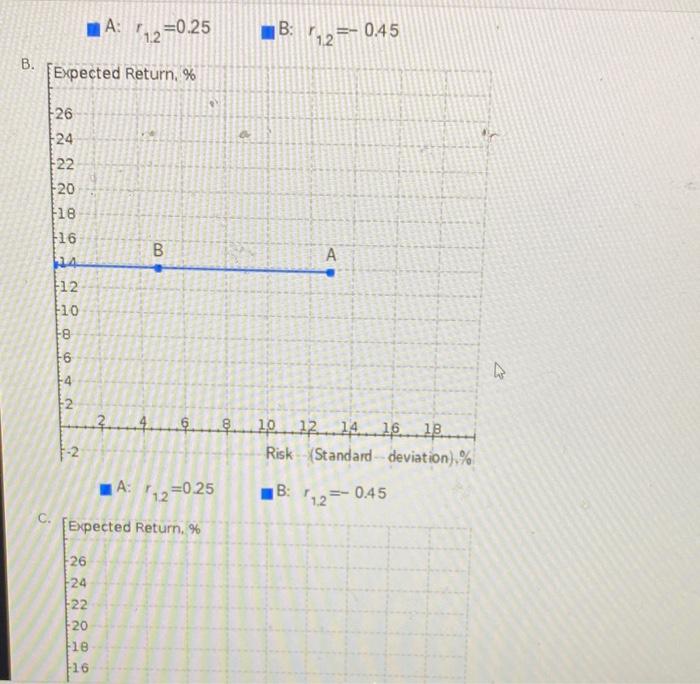
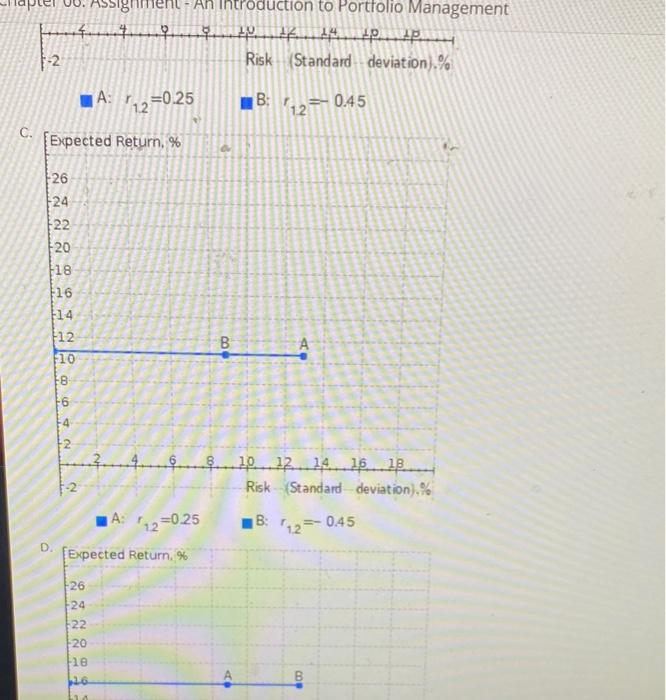
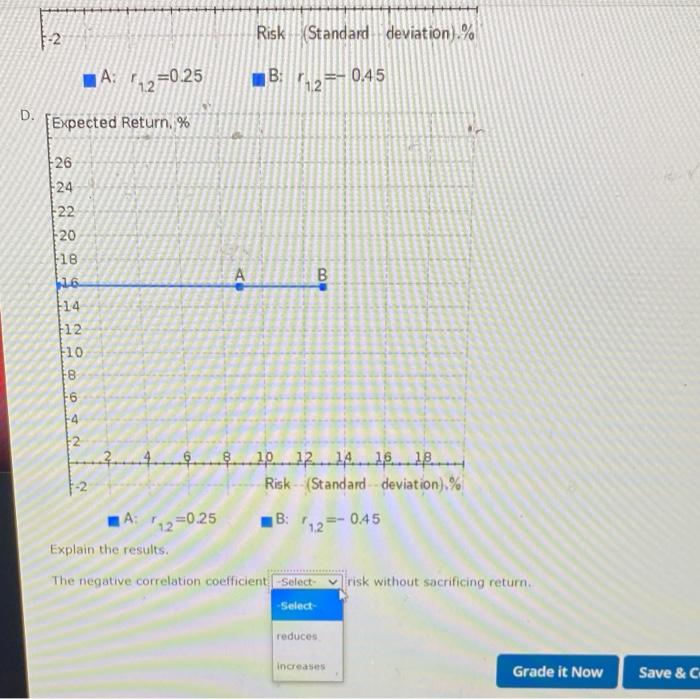
Q Search this col Chapter 06: Assignment - An Introduction to Portfolio Management WE- 0.6 You are considering two sets with the following characteristics. ER) 0.13 E) 0.11 ER) - 0.20 (02) - 0.24 W2-04 Compute the mean and standard deviation of two portfolios ut 0.25 and 0.45, respectively. Do not round uitermediate caktions. Round your own for the mean of te portfolio three decimal places and answers for standard deviations of two portfolios to live decimal places Mean of two portfolio Standard deviation of two portfolosi 0.25 Standard deviation of the purtroli 0.451 Choose the correcto-retor graph The correct gratis Expected retum 26 24 22 20 18 bo 24 12 10 16 1A (12=0.25 B: 12=-0.45 B. Expected Return, % 26 24 22 20 +18 $16 00 B A F12 +10 FB 6 -4 2 + 4 6 . 100 10 12 14 16 18 Risk Standard deviation) % N B: 142 0.45 A: 12 2=0.25 Expected Return. % C. DO 26 24 +22 20 18 16 Assignment - An Introduction to Portfolio Management 4 4 . . Risk Standard deviation) % -2. A: Y=0.25 1.21 B: +12= 0.45 C. [Expected Return, % 26 24 22 20 18 116 F14 12 10 18 000 B -4 4 6 10.12 14 16 18 Risk (Standard deviation).% A: 12=0.25 B: 112= -0.45 Expected Return. % 26 +24 NNN 22 20 20 20 CO B Risk (Standard deviation).% A: +12=0.25 A B: 112=- 0.45 D. [Expected Return, % 26 24 +22 20 18 A 100 B 14 F12 +10 NA 8 NOO 10 1.121.1.18 1-2 Risk (Standard deviation) % A: 12=0.25 B: 1.2 045 Explain the results. The negative correlation coefficient Select yrisk without sacrificing return Select reduces increases Grade it Now Save & C Q Search this col Chapter 06: Assignment - An Introduction to Portfolio Management WE- 0.6 You are considering two sets with the following characteristics. ER) 0.13 E) 0.11 ER) - 0.20 (02) - 0.24 W2-04 Compute the mean and standard deviation of two portfolios ut 0.25 and 0.45, respectively. Do not round uitermediate caktions. Round your own for the mean of te portfolio three decimal places and answers for standard deviations of two portfolios to live decimal places Mean of two portfolio Standard deviation of two portfolosi 0.25 Standard deviation of the purtroli 0.451 Choose the correcto-retor graph The correct gratis Expected retum 26 24 22 20 18 bo 24 12 10 16 1A (12=0.25 B: 12=-0.45 B. Expected Return, % 26 24 22 20 +18 $16 00 B A F12 +10 FB 6 -4 2 + 4 6 . 100 10 12 14 16 18 Risk Standard deviation) % N B: 142 0.45 A: 12 2=0.25 Expected Return. % C. DO 26 24 +22 20 18 16 Assignment - An Introduction to Portfolio Management 4 4 . . Risk Standard deviation) % -2. A: Y=0.25 1.21 B: +12= 0.45 C. [Expected Return, % 26 24 22 20 18 116 F14 12 10 18 000 B -4 4 6 10.12 14 16 18 Risk (Standard deviation).% A: 12=0.25 B: 112= -0.45 Expected Return. % 26 +24 NNN 22 20 20 20 CO B Risk (Standard deviation).% A: +12=0.25 A B: 112=- 0.45 D. [Expected Return, % 26 24 +22 20 18 A 100 B 14 F12 +10 NA 8 NOO 10 1.121.1.18 1-2 Risk (Standard deviation) % A: 12=0.25 B: 1.2 045 Explain the results. The negative correlation coefficient Select yrisk without sacrificing return Select reduces increases Grade it Now Save & C