

Question: Q1 [2 Points) Average Retruns (Expected Returns) MONTHLY. Use the data in the RETURNS tab and Excel =AVERAGE() function to compute expected returns for 3
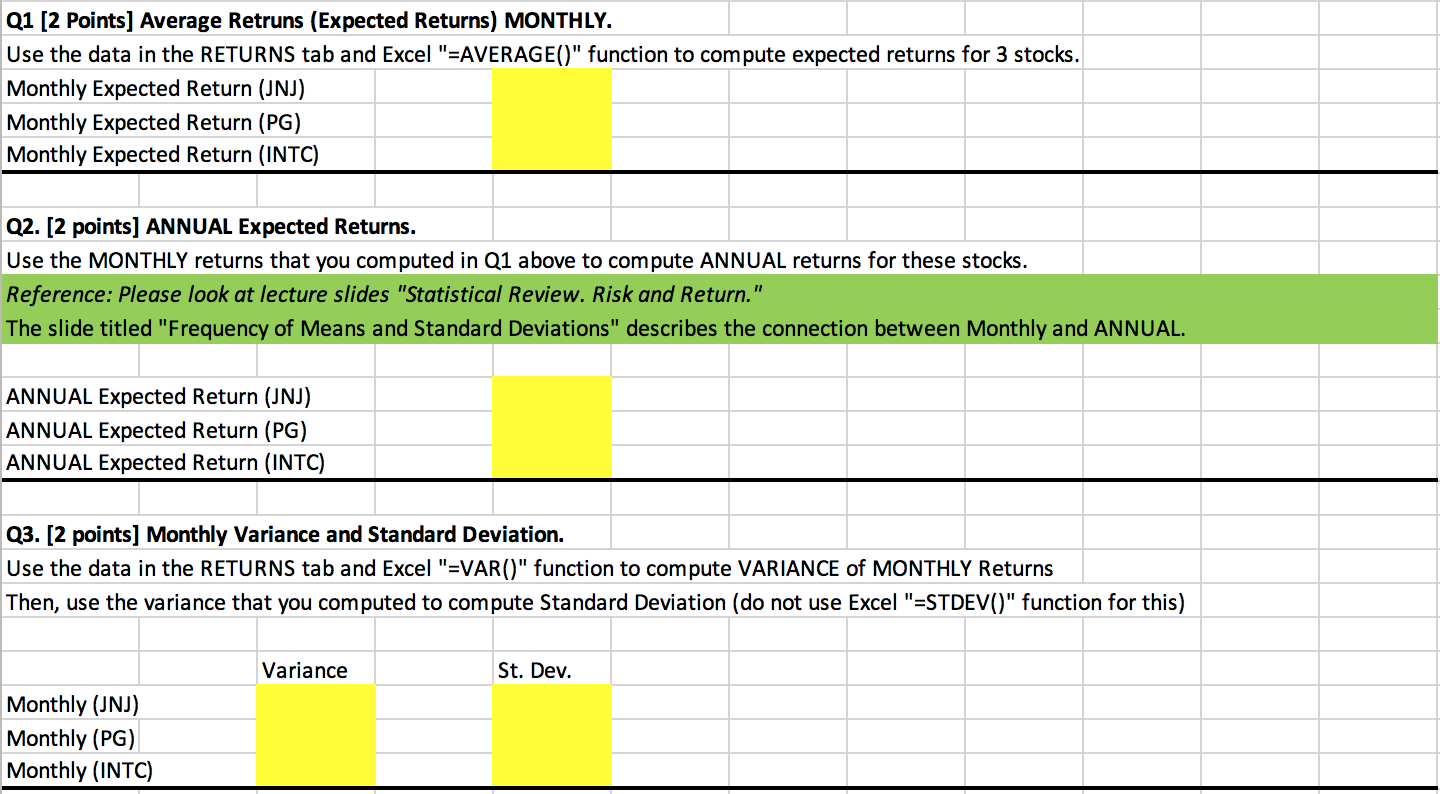
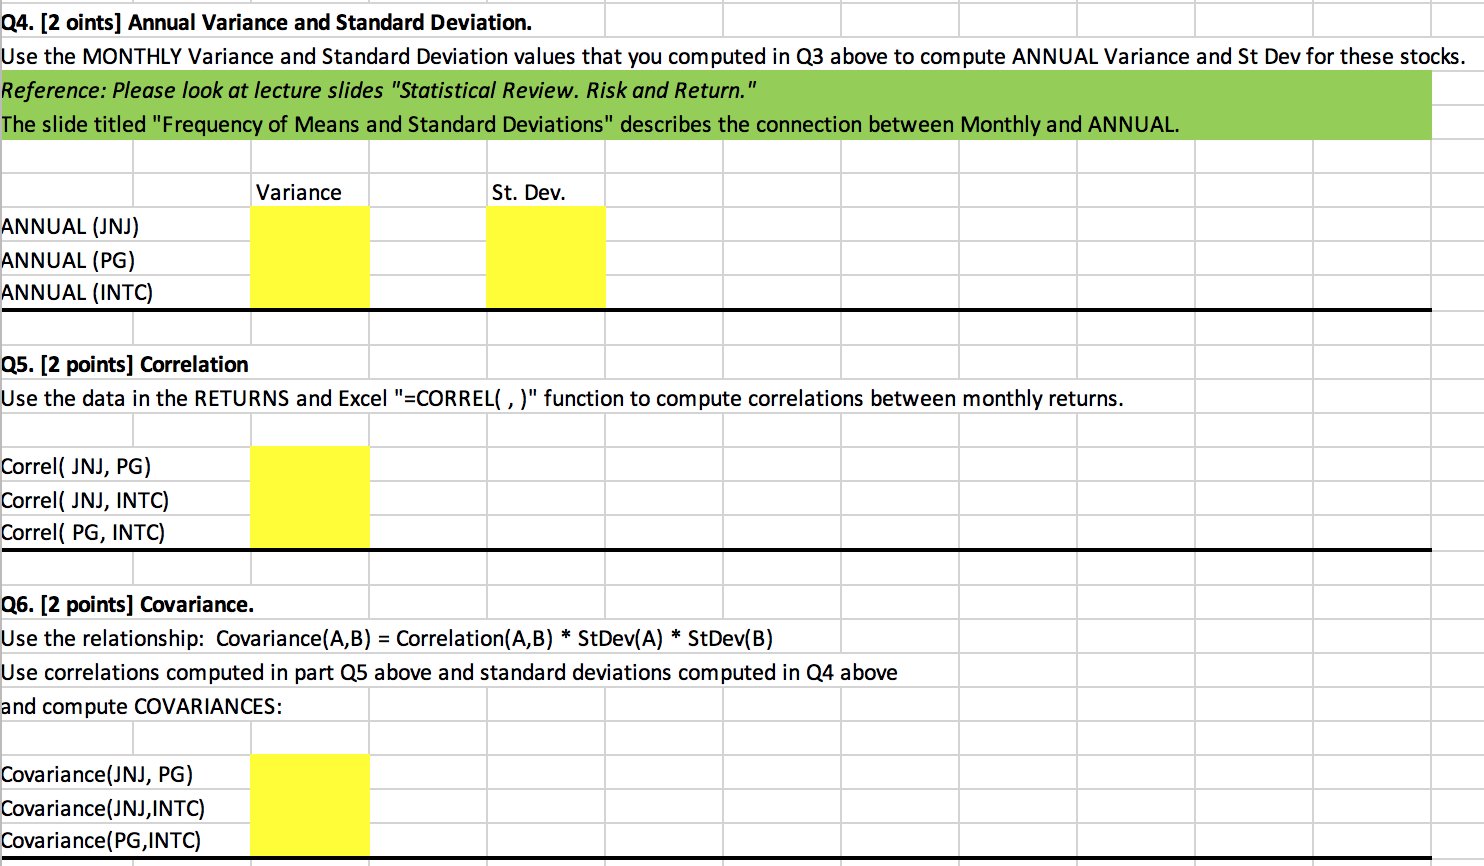
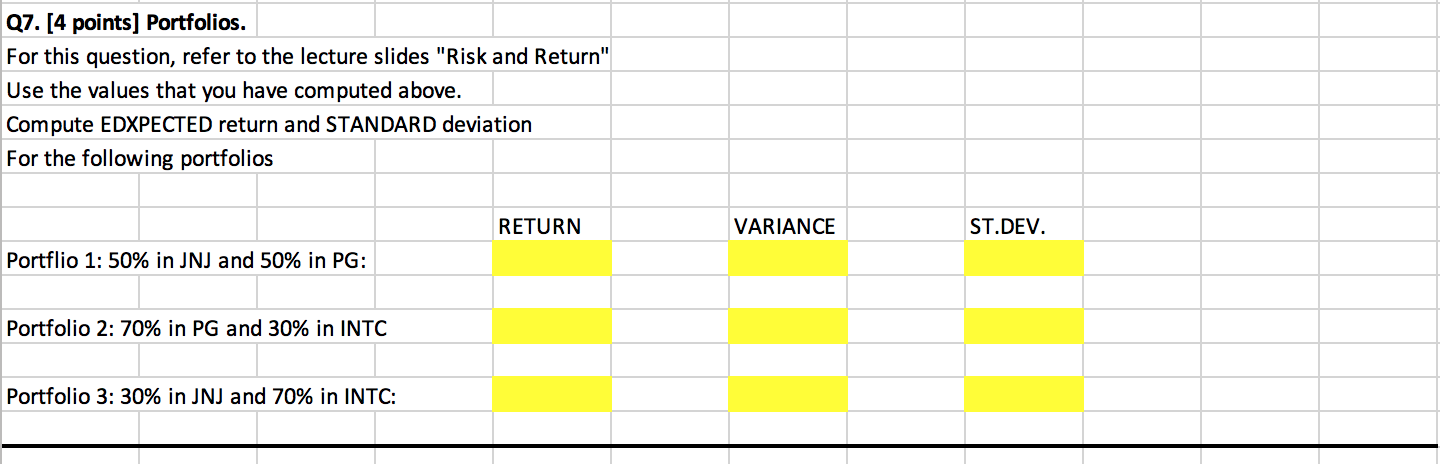
Q1 [2 Points) Average Retruns (Expected Returns) MONTHLY. Use the data in the RETURNS tab and Excel "=AVERAGE()" function to compute expected returns for 3 stocks. Monthly Expected Return (JNJ) Monthly Expected Return (PG) Monthly Expected Return (INTC) Q2. [2 points] ANNUAL Expected Returns. Use the MONTHLY returns that you computed in Q1 above to compute ANNUAL returns for these stocks. Reference: Please look at lecture slides "Statistical Review. Risk and Return." The slide titled "Frequency of Means and Standard Deviations" describes the connection between Monthly and ANNUAL. ANNUAL Expected Return (JNJ) ANNUAL Expected Return (PG) ANNUAL Expected Return (INTC) Q3. [2 points) Monthly Variance and Standard Deviation. Use the data in the RETURNS tab and Excel "=VAR(" function to compute VARIANCE of MONTHLY Returns Then, use the variance that you computed to compute Standard Deviation (do not use Excel "=STDEV(" function for this) Variance St. Dev. Monthly (JNJ) Monthly (PG) Monthly (INTC) Q4. [2 oints] Annual Variance and Standard Deviation. Use the MONTHLY Variance and Standard Deviation values that you computed in Q3 above to compute ANNUAL Variance and St Dev for these stocks. Reference: Please look at lecture slides "Statistical Review. Risk and Return." The slide titled "Frequency of Means and Standard Deviations" describes the connection between Monthly and ANNUAL. Variance St. Dev. ANNUAL (INJ) ANNUAL (PG) ANNUAL (INTC) Q5. [2 points) Correlation Use the data in the RETURNS and Excel "=CORRELO)" function to compute correlations between monthly returns. Correl( JNJ, PG) Correl( JNJ, INTC) Correl( PG, INTC) Q6. [2 points) Covariance. Use the relationship: Covariance(A,B) = Correlation(A,B) * StDev(A) * StDev(B) Use correlations computed in part 25 above and standard deviations computed in Q4 above and compute COVARIANCES: Covariance (JNJ, PG) Covariance (JNJ,INTC) Covariance(PG,INTC) Q7. [4 points) Portfolios. For this question, refer to the lecture slides "Risk and Return" Use the values that you have computed above. Compute EDXPECTED return and STANDARD deviation For the following portfolios RETURN VARIANCE ST.DEV. Portflio 1: 50% in JNJ and 50% in PG: Portfolio 2: 70% in PG and 30% in INTC Portfolio 3: 30% in JNJ and 70% in INTC: Q1 [2 Points) Average Retruns (Expected Returns) MONTHLY. Use the data in the RETURNS tab and Excel "=AVERAGE()" function to compute expected returns for 3 stocks. Monthly Expected Return (JNJ) Monthly Expected Return (PG) Monthly Expected Return (INTC) Q2. [2 points] ANNUAL Expected Returns. Use the MONTHLY returns that you computed in Q1 above to compute ANNUAL returns for these stocks. Reference: Please look at lecture slides "Statistical Review. Risk and Return." The slide titled "Frequency of Means and Standard Deviations" describes the connection between Monthly and ANNUAL. ANNUAL Expected Return (JNJ) ANNUAL Expected Return (PG) ANNUAL Expected Return (INTC) Q3. [2 points) Monthly Variance and Standard Deviation. Use the data in the RETURNS tab and Excel "=VAR(" function to compute VARIANCE of MONTHLY Returns Then, use the variance that you computed to compute Standard Deviation (do not use Excel "=STDEV(" function for this) Variance St. Dev. Monthly (JNJ) Monthly (PG) Monthly (INTC) Q4. [2 oints] Annual Variance and Standard Deviation. Use the MONTHLY Variance and Standard Deviation values that you computed in Q3 above to compute ANNUAL Variance and St Dev for these stocks. Reference: Please look at lecture slides "Statistical Review. Risk and Return." The slide titled "Frequency of Means and Standard Deviations" describes the connection between Monthly and ANNUAL. Variance St. Dev. ANNUAL (INJ) ANNUAL (PG) ANNUAL (INTC) Q5. [2 points) Correlation Use the data in the RETURNS and Excel "=CORRELO)" function to compute correlations between monthly returns. Correl( JNJ, PG) Correl( JNJ, INTC) Correl( PG, INTC) Q6. [2 points) Covariance. Use the relationship: Covariance(A,B) = Correlation(A,B) * StDev(A) * StDev(B) Use correlations computed in part 25 above and standard deviations computed in Q4 above and compute COVARIANCES: Covariance (JNJ, PG) Covariance (JNJ,INTC) Covariance(PG,INTC) Q7. [4 points) Portfolios. For this question, refer to the lecture slides "Risk and Return" Use the values that you have computed above. Compute EDXPECTED return and STANDARD deviation For the following portfolios RETURN VARIANCE ST.DEV. Portflio 1: 50% in JNJ and 50% in PG: Portfolio 2: 70% in PG and 30% in INTC Portfolio 3: 30% in JNJ and 70% in INTC
Step by Step Solution
There are 3 Steps involved in it

Get step-by-step solutions from verified subject matter experts