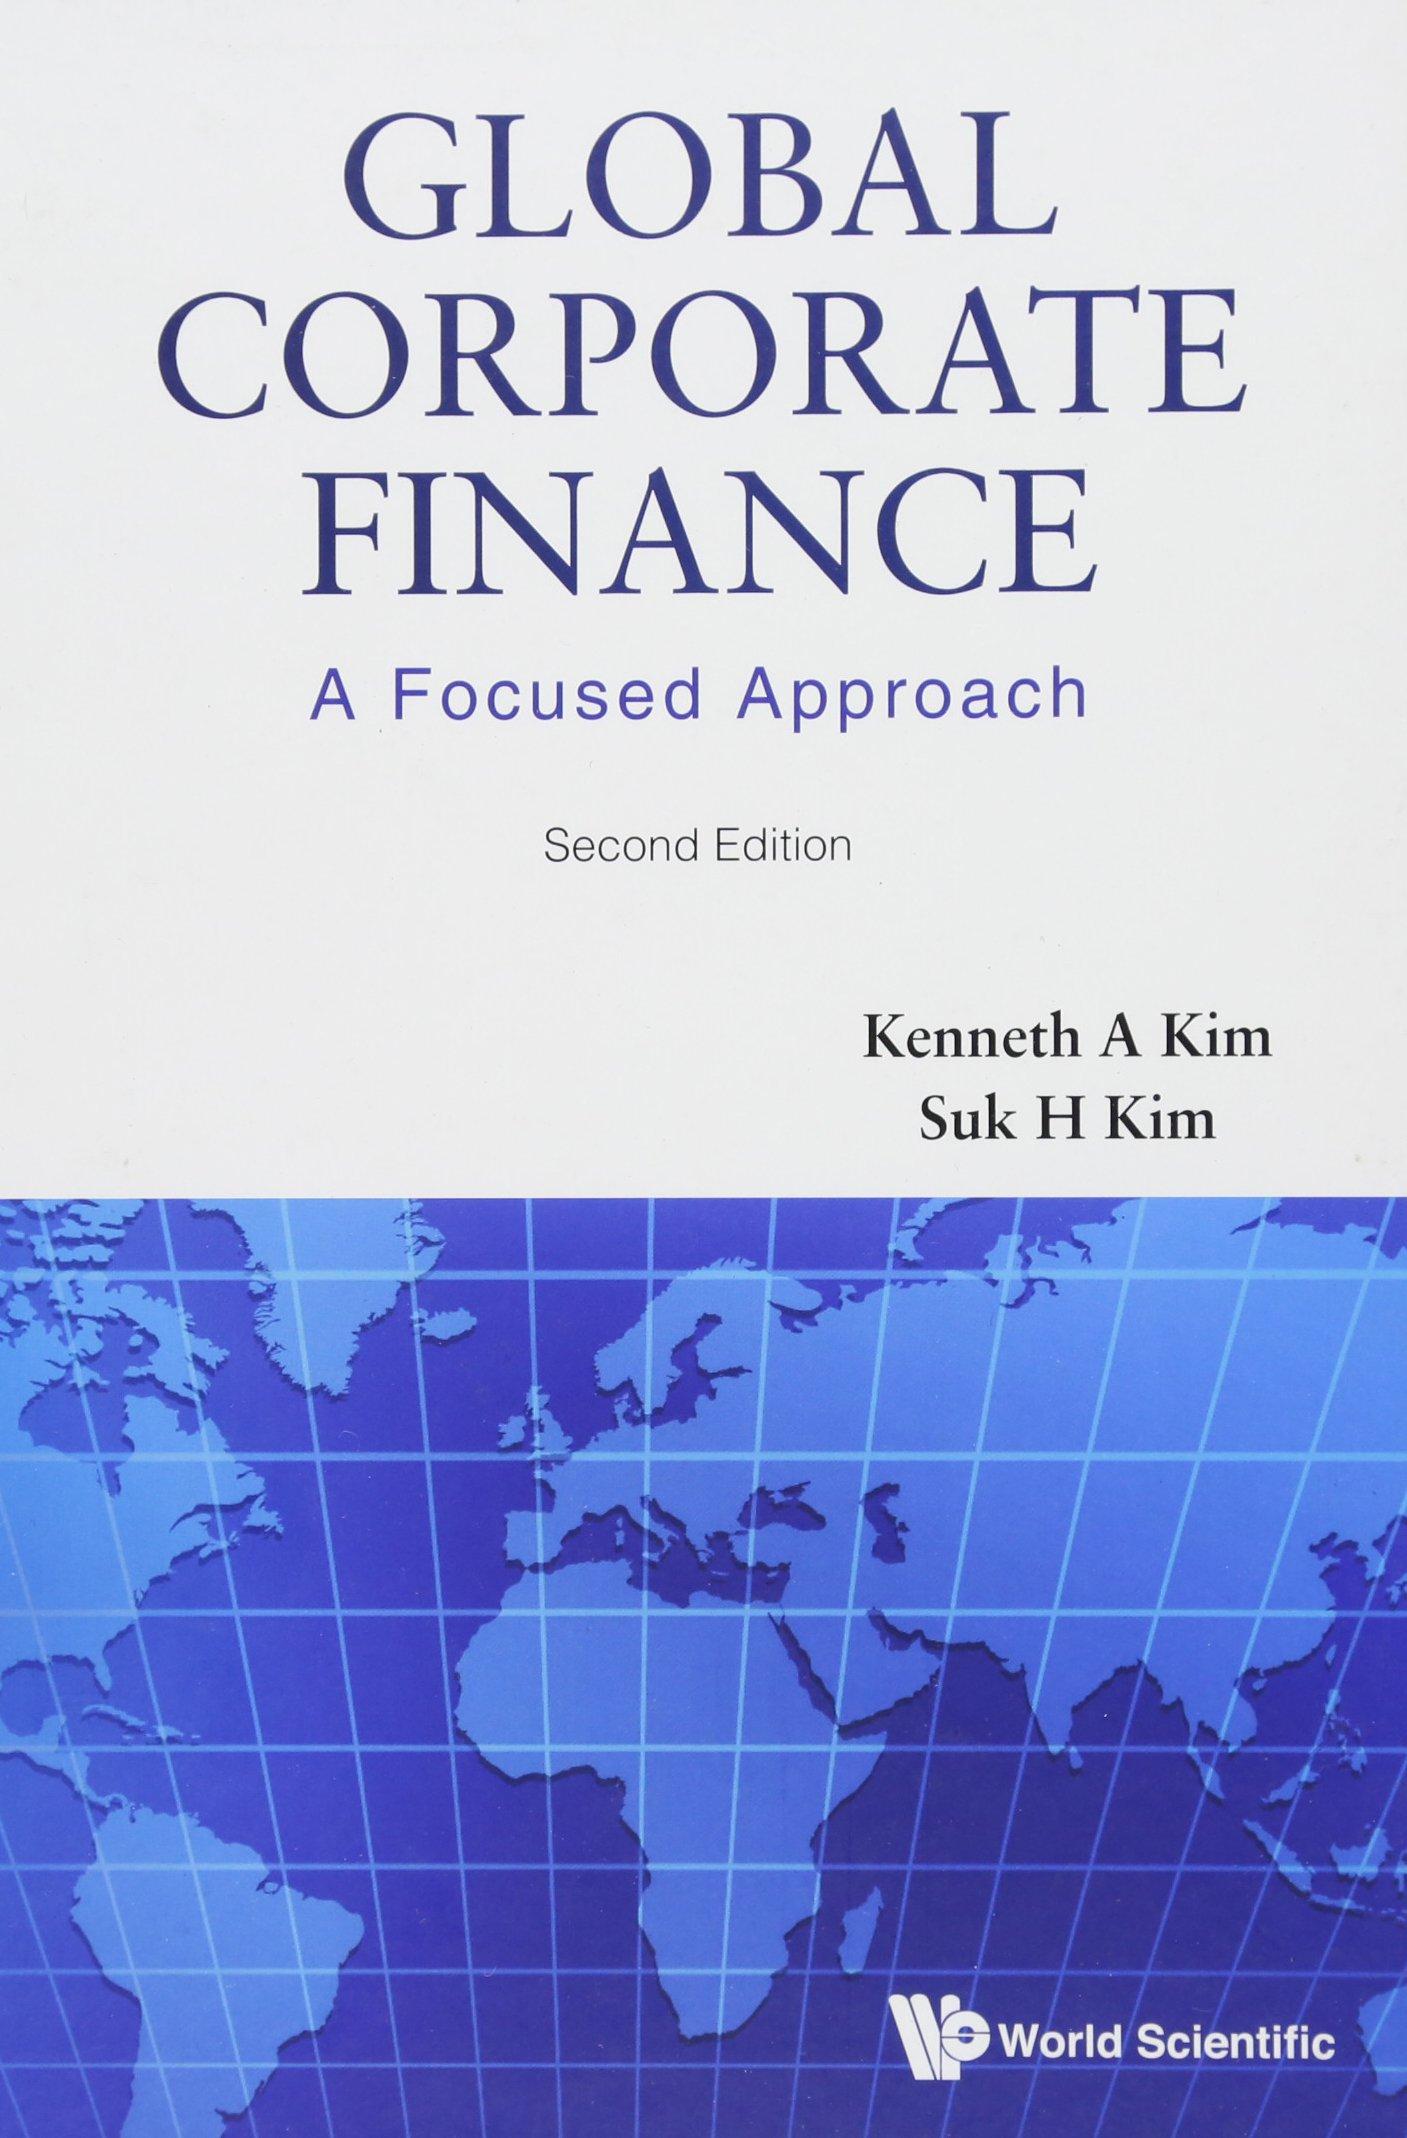
Question
Q1: Index Models: Download 61 months (May 2009 to May 2014) of monthly data for the S&P 500 index (symbol = ^GSPC). Download 61 months
Q1: Index Models:
Download 61 months (May 2009 to May 2014) of monthly data for the S&P 500 index (symbol = ^GSPC). Download 61 months (May 2009 to May 2014) of Apple Inc. data and 61 months (May 2009 to May 2014) of Exxon Mobil Corporation data. Download 60 months (June 2009 to May 2014) of the 13 week T-bill rate (symbol = ^IRX). Be sure to use end-of-month data! Construct the following on a spreadsheet:
1. Calculate 60 months of returns for the S&P 500 index, Apple and Exxon. Use June 2009 to May 2014. Note this means you need price data for May 2009. On the answer sheet report the average monthly returns for the S&P 500 index, Apple and Exxon, as well as the average monthly risk-free rate.
2. Calculate excess returns for the S&P 500 index, Apple and Exxon. Note you must divide the annualized risk-free rate (^IRX) by 1200 to approximate the monthly rate in in decimal form. On the answer sheet report the average monthly excess returns for the S&P 500 index, Apple and Exxon.
3. Regress excess Apple returns on the excess S&P 500 index returns and report, on the answer sheet, ?, ?, the r-square and whether ? and ? are different from zero at the 5% level of significance. Briefly explain your inference.
4. Use equation 8.10 to decompose total risk for Apple into systematic risk and firm-specific risk. That is, calculate total risk, systematic risk and firm-specific risk for Apple.
5. Regress excess Exxon returns on the excess S&P 500 index returns and report, on the answer sheet, ?, ?, the r-square and whether ?, ? are different from zero at the 5% level of significance. Briefly explain your inference.
6. Use equation 8.10 to decompose total risk for Exxon into systematic risk and firm-specific risk. That is, calculate total risk, systematic risk and firm-specific risk for Exxon.
7. Use equation 8.10 to estimate the covariance and correlation of Apple and Exxon excess returns.
Step by Step Solution
There are 3 Steps involved in it
Step: 1

Get Instant Access to Expert-Tailored Solutions
See step-by-step solutions with expert insights and AI powered tools for academic success
Step: 2

Step: 3

Ace Your Homework with AI
Get the answers you need in no time with our AI-driven, step-by-step assistance
Get Started


