

Question
Q1. Pearson's Correlation (15 points) ( Round calculated results to the hundredth (2 nd place to the right of the decimal) when result extends beyond
Q1. Pearson's Correlation (15 points) (Round calculated results to the hundredth (2nd place to the right of the decimal) when result extends beyond that unless otherwise noted).
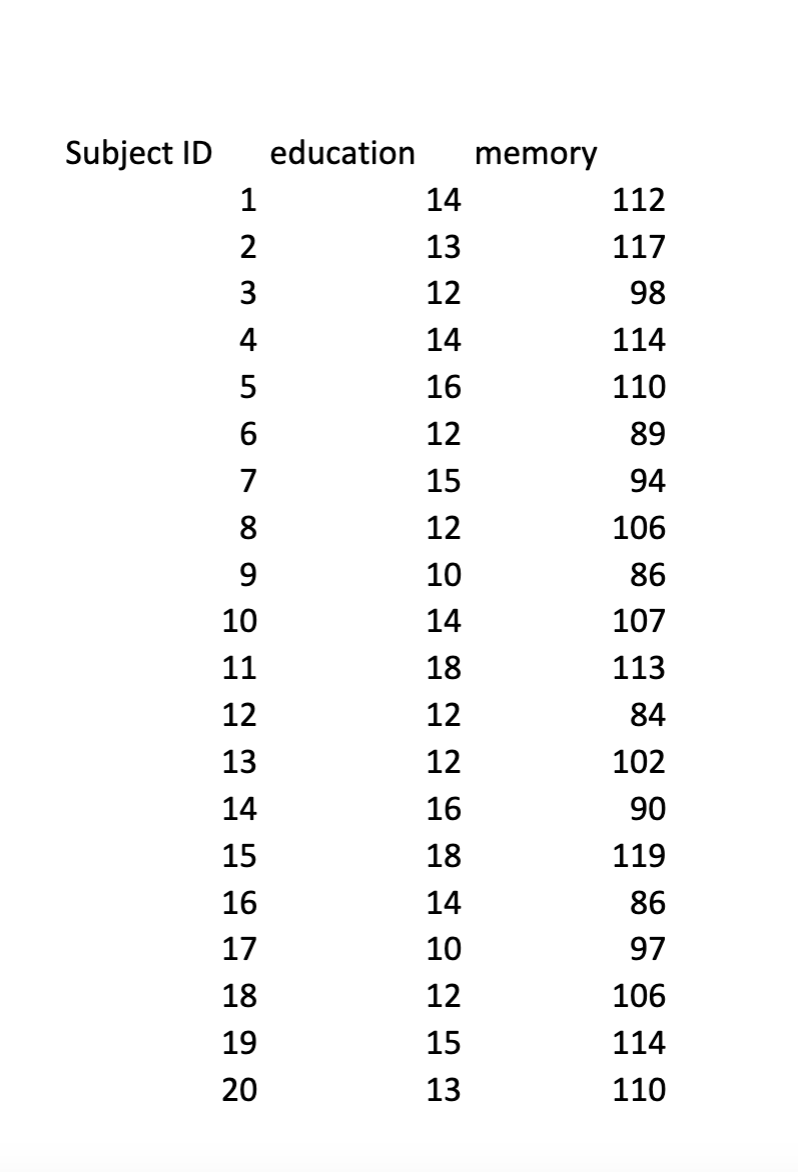
The data set for this question set (Tab Q1 in the Excel data file) comes from a research project that tracks the elderly residents in a community to monitor their cognitive function and general health. Based on the literature, education is considered a protective factor against dementia, and memory decline is usually the first sign of dementia. So, the researchers would like to know whether education level (measured in number of years of formal schooling) is correlated with memory function (a standardized memory test score) in their sample of elderly residents.
Q1a. Make a scatter plot between the two variables using Excel. Paste the plot here and format it into an APA "figure" (see Assignment Guides for APA ). Be sure to submit the Excel file that you used to create the scatter plot.
- 0.5 for correct scatter graph type
- 0.5 for the two axis labels (deduct 0.5 even if only one label is missing)
- 0.5 for APA (figure number and caption at bottom, figure number is italic)
- 0.5 for correct data from the two variables on the X and Y axes
Paste Table Here: |
Q1b. Calculate the mean and standard deviation for the two variables separately.
Q1c. Calculate the Z scores for all the scores of the two variables, separately.
Tips: It may help to prevent error and to increase clarity if the process and/or the answers (z scores) are listed in a table format.
Q1d. Calculate Pearson's correlation coefficient r.
Q1e. Explain the direction and strength of the relationship based on the r.
Q1f. What is the proportion of variance shared between the two variables? (That is, how much of the variance in one variable can be predicted by the variance in the other variable?) (Do not round during the calculation, the final result as the percentage should be to the hundredth [2nd decimal])
Q1g. If the researcher wants to perform a two-tailed hypothesis test using this data set so that she can generalize the relationship between the two variables from the sample to the population, what would be the null and alternative hypothesis? Write the hypotheses in words and in symbol notation.
| Written | Symbolic Symbol bank for copy & pasting: =m r | |
| Null | H0: | |
| Alternative | H1: |
Q1h. Using SPSS to analyze the same dataset yields a p value of .063. Based on ? = .05, what would be the conclusion of the hypothesis test (use wording of "reject the null hypothesis" or "fail to reject the null hypothesis"? How do you know?
Step by Step Solution
There are 3 Steps involved in it
Step: 1

Get Instant Access to Expert-Tailored Solutions
See step-by-step solutions with expert insights and AI powered tools for academic success
Step: 2

Step: 3
Ace Your Homework with AI
Get the answers you need in no time with our AI-driven, step-by-step assistance
Get Started