

Answered step by step
Verified Expert Solution
Question
1 Approved Answer
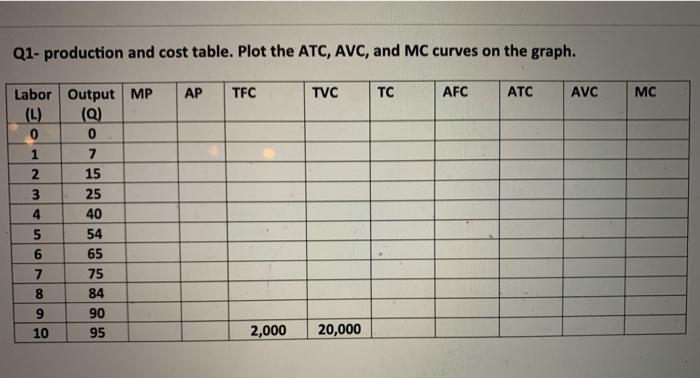
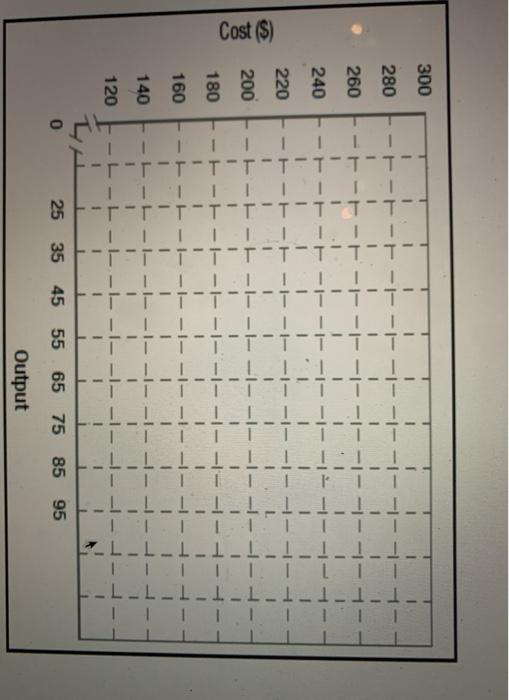
Q1- production and cost table. Plot the ATC, AVC, and MC curves on the graph. AP TFC TVC TC AFC ATC AVC MC Labor Output
Step by Step Solution
There are 3 Steps involved in it
Step: 1

Get Instant Access to Expert-Tailored Solutions
See step-by-step solutions with expert insights and AI powered tools for academic success
Step: 2

Step: 3
Ace Your Homework with AI
Get the answers you need in no time with our AI-driven, step-by-step assistance
Get Started
Accounting Essentials For Hospitality Managers
Authors: Chris Guilding, Kate Mingjie Ji
4th Edition
1032024321, 9781032024325