Question
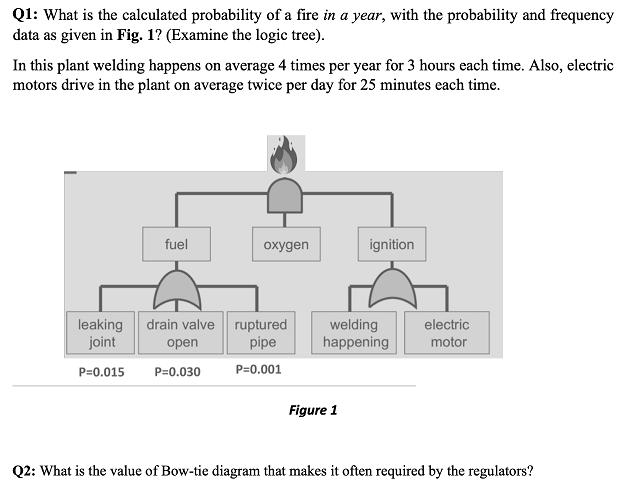
Q1: What is the calculated probability of a fire in a year, with the probability and frequency data as given in Fig. 1? (Examine

Q1: What is the calculated probability of a fire in a year, with the probability and frequency data as given in Fig. 1? (Examine the logic tree). In this plant welding happens on average 4 times per year for 3 hours each time. Also, electric motors drive in the plant on average twice per day for 25 minutes each time. fuel leaking drain valve joint open P=0.015 P=0.030 oxygen ruptured pipe P=0.001 ignition welding happening Figure 1 electric motor Q2: What is the value of Bow-tie diagram that makes it often required by the regulators?
Step by Step Solution
There are 3 Steps involved in it
Step: 1

Get Instant Access to Expert-Tailored Solutions
See step-by-step solutions with expert insights and AI powered tools for academic success
Step: 2

Step: 3

Ace Your Homework with AI
Get the answers you need in no time with our AI-driven, step-by-step assistance
Get StartedRecommended Textbook for
Introductory Statistics
Authors: Prem S. Mann
8th Edition
9781118473986, 470904100, 1118473981, 978-0470904107
Students also viewed these Chemical Engineering questions
Question
Answered: 1 week ago
Question
Answered: 1 week ago
Question
Answered: 1 week ago
Question
Answered: 1 week ago
Question
Answered: 1 week ago
Question
Answered: 1 week ago
Question
Answered: 1 week ago
Question
Answered: 1 week ago
Question
Answered: 1 week ago
Question
Answered: 1 week ago
Question
Answered: 1 week ago
Question
Answered: 1 week ago
Question
Answered: 1 week ago
Question
Answered: 1 week ago
Question
Answered: 1 week ago
Question
Answered: 1 week ago
Question
Answered: 1 week ago
Question
Answered: 1 week ago
Question
Answered: 1 week ago
Question
Answered: 1 week ago
Question
Answered: 1 week ago
View Answer in SolutionInn App


