Answered step by step
Verified Expert Solution
Question
1 Approved Answer
Aircraft integrated structural health monitoring using lasers, piezoelectricity, and fiber optics Check for update Yunshil Choi, Syed Haider Abbas, Jung-Ryul Lee Department of Aerospace
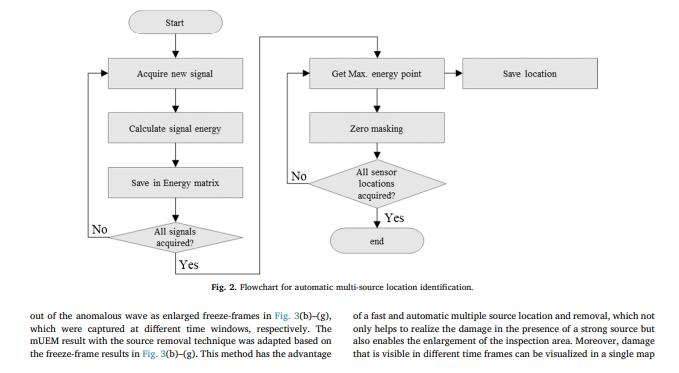
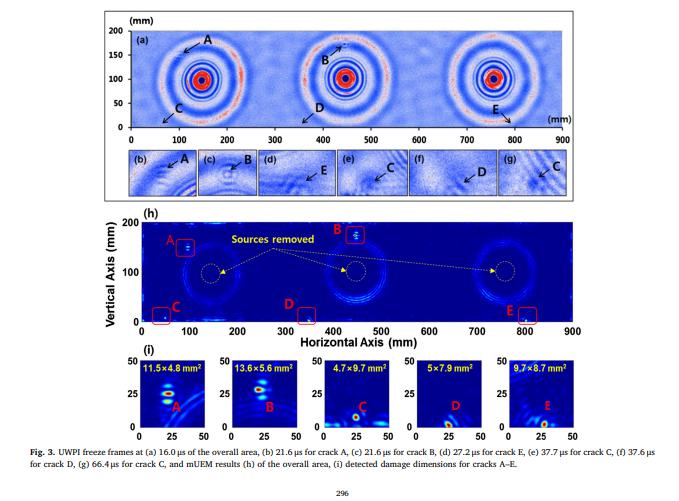
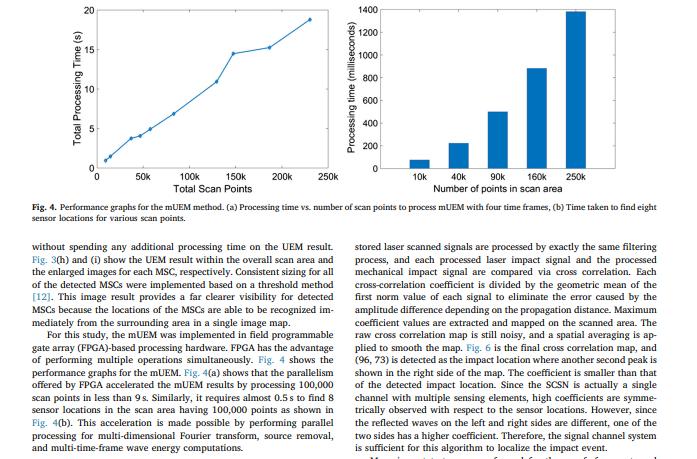
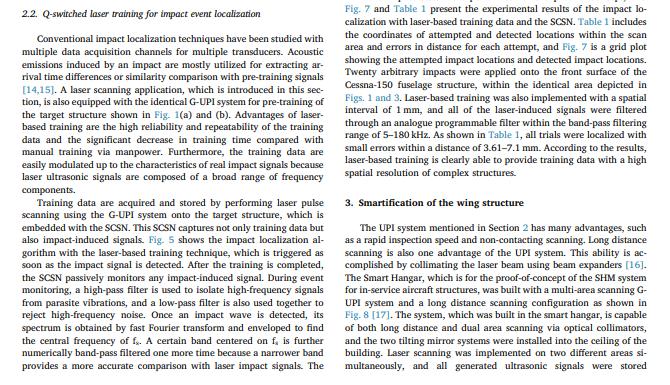
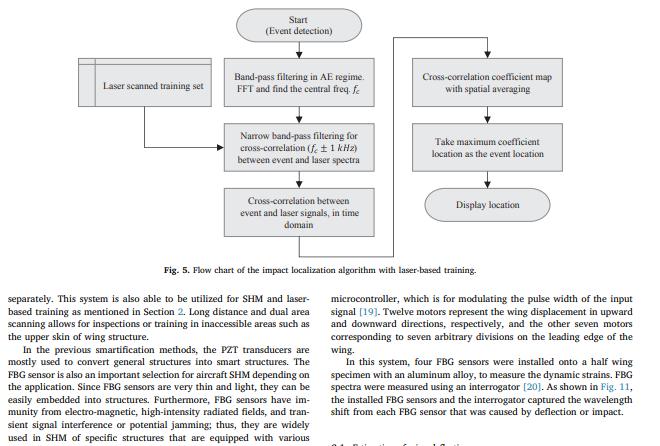
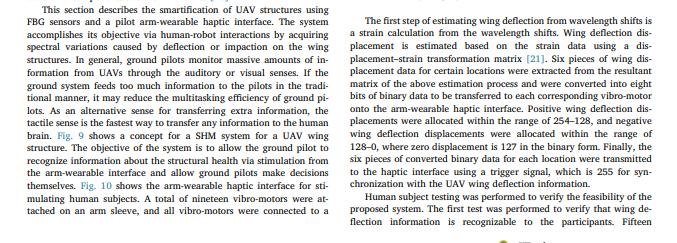
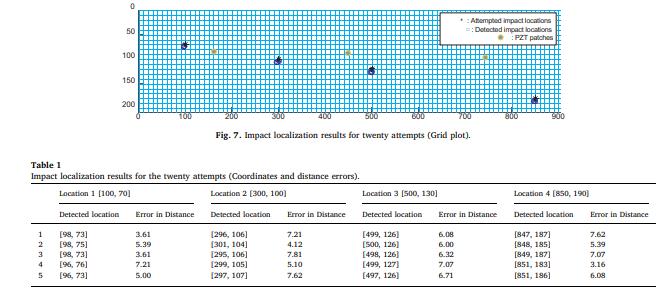
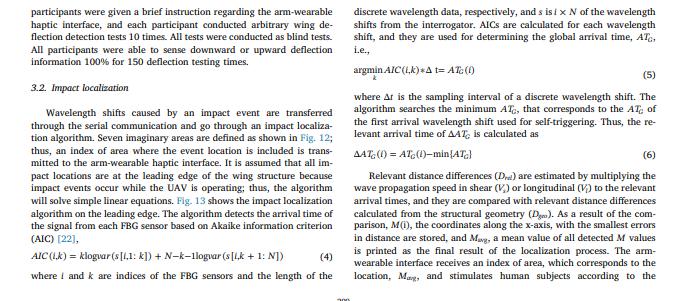
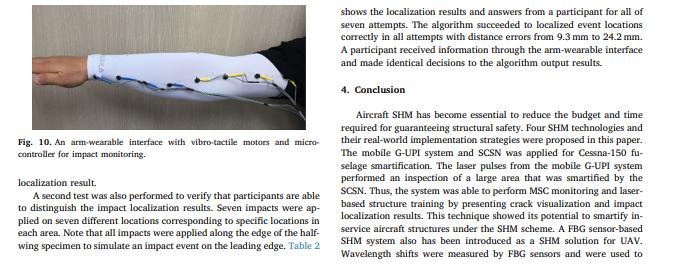
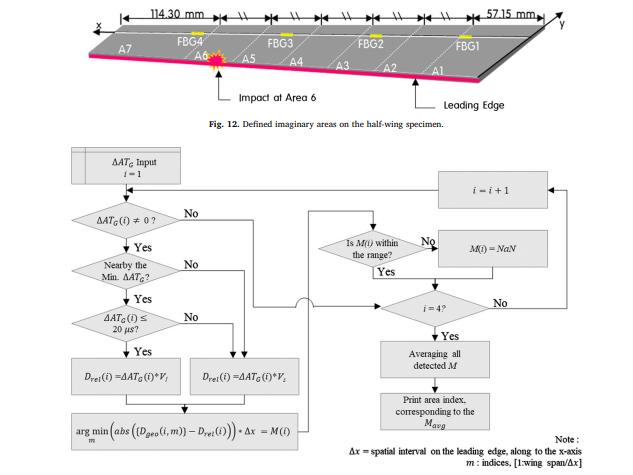
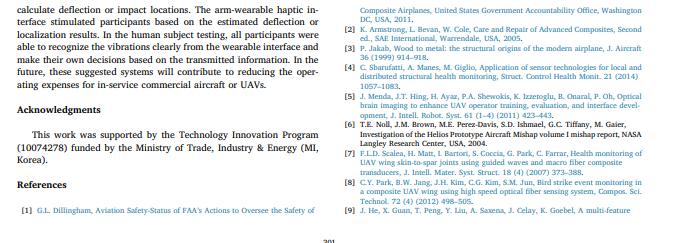
Aircraft integrated structural health monitoring using lasers, piezoelectricity, and fiber optics Check for update Yunshil Choi, Syed Haider Abbas, Jung-Ryul Lee Department of Aerospace Engineering, Korea Advanced Institute of Science and Technology, Daejoen, Republic of Korea ARTICLE INFO ABSTRACT Keywords: Integrated structural health monitoring Laser ultrasonic Fiber Bragg Grating Piezoelectric Various structural health monitoring (SHM) systems that have been developed based on laser ultrasonics and fiber optics are introduced in this paper. The systems are used to realize the new SHM paradigm for ground SHM, called the Smart Hangar. Guided wave ultrasonic propagation imaging (G-UPI) technology is implemented in the Smart Hangar in the form of built-in and mobile G-UPI systems. The laser-induced guided waves generated by pulsed beam scanning in the wings and fuselage of an aircraft are captured by a fiber optic, piezoelectric, or laser ultrasonic sensor, and their propagation is visualized. The wave propagation video is further processed to vi- sualize damage in the presence of multiple sources using a multi-time-frame ultrasonic energy mapping (mUEM) method. For in-flight SHM, laser scanning-based smartification of the structure with sensors is presented, and an event localization method based on fiber optics and piezoelectric sensing is also introduced. Optic sensors are also utilized to reconstruct the wing deformation from the measured strain. The wing deformation and impact localization information is transferred to a ground pilot in the case of unmanned aerial vehicles (UAV), and the ground pilot can feel the wing deformation and impact by using a pilot arm-wearable haptic interface, which makes it possible to achieve human-UAV interactive decision making. 1. Introduction Composite materials as aerospace engineering materials have var- ious advantages, including an optimal strength-to-weight, a good stiff- ness-to-weight ratio, and resistance to corrosion and fatigue. The usage of composite materials has been increasing rapidly in aerospace in- dustrial fields due to these benefits. In the past decade, aircraft manu- facturers have extended the ratio of composite uses so that its usage has exceeded 50 percent in recently developed aircraft structures, such as fuselages and wing skins [1]. However, metallic materials are still comprising the main structures of aircrafts to prevent the critical issues of composite materials; they are more brittle than wrought metals and cause more complex failure modes [2]. Particularly, aluminum alloys (Al-alloys) are utilized as the main materials for constructing airframes, such as skins, spars and ribs, and these alloys allow the structures to reduce the overall weight [3]. However, the structures with Al-alloys may also experience both low and high cycle fatigue cracking during their lifetime due to excessive and repeated loading environments. In the case of aircraft accidents by structural defects or damage, it is very fatal not only in terms of cost but also for human safety. Thus, structural health monitoring (SHM) technology is essential for reducing the risk of catastrophic failures and for improving the safety of structures by detecting damage before it reaches a critical state [4]. SHM for unmanned aerial vehicles (UAVs) also has been advanced due to the increasing UAV employments in recent years. UAVs have many advantages regarding safety. However, UAV accidents occur at a much higher rate than accidents in most manned aircrafts, thus, it is essential to address the issue of UAV safety and performance [5]. Since a UAV is an aircraft without human pilots aboard, abnormal dynamic behaviors of the UAVs may be ignored, which can cause more fatal accidents such as destruction of the entire UAV structure. As a representative case, the in-flight break-up of NASA's Helios wing was reported in 2003 [6]. Various approaches have been studied regarding SHM for UAVs. Scalea et al. suggested a SHM system for a composite wing skin-to-spar joint in UAVs with ultrasonic guided waves and a macro-fiber composite transducer [7], and Park et al. presented an impact monitoring system with optical fiber sensors [8]. In this paper, smartification techniques for aircraft SHM are pro- posed in which the SHM systems are based on laser-scanning, piezo- electric (PZT) sensors, and Fiber Bragg Grating (FBG) sensors. In Section 2, laser-scanning-based G-UPI systems for fuselage structures are introduced with an inspection result for simulated multisite cracks (MSCs). Impact localization with a laser-based training technique and its proof-of-concept is presented as a strategy of smartification of the fuselage. In Section 3, a wing smartification technique for an UAV is proposed based on pilot-UAV interactive decision making for SHM. 2. Smartification of the fuselage structure 2.1. Q-switched laser stimulation-based multisite damage visualization Several fatal aircraft crashes have been reported over the last 70 years; the de Havilland Comet crashes (1954), the Japan Airlines Flight 123 Boeing 747SR crash (1985), the Aloha Airlines Flight 243 Boeing 737-297 crash (1988), the China Airlines Flight 611 Boeing 747- 209B crash (2002), and the Southwest Airlines Flight 2294 and the 812 Boeing 737-3H4 crashes (2009 and 2011). These crashes were caused by MSCs on fuselage structures with metal. MSCs are typically origi- nating from riveted joints in a loaded fuselage and tears in the aircraft's skin [9]. Various diagnostic techniques for SHM have been studied for fuselages structures. Because PZT transducers have several advantages, which include the small size, inexpensive cost and ability to be affixed in a minimally intrusive way to structures, these are one of the widely selected transducers for SHM studies and applications. However, pre- vious studies showed the critical disadvantage that the suggested sys- tems implemented SHM only at the hotspots, such as at fastener holes [10]. This approach requires many transducers and sensing channels for the general and wide structural areas. In this section, a serially connected PZT sensor network (SCSN) and Q-switched laser stimulation near the PZTS is introduced for smartifi- cation of the airplane structure. A real metallic fuselage is used for demonstration of this approach. The fuselage section with the SCSN responds to the Q-switched laser beam stimulation and eventually vi- sualizes the damage. UPI is a laser ultrasonic testing technique that has shown high feasibility for overcoming the drawbacks of previous stu- dies for global damage monitoring [11]. The UPI systems have been developed into different versions, such as G-UPI using a surface wave and Lamb wave and a bulk wave (B)-UPI using pulse-echo and through- transmission modes. The G-UPI system monitors multisite damage si- multaneously by covering a wide area during a one-time inspection. Furthermore, the G-UPI system is able to cover a wider area by adapting the SCSN [12]. As shown in Fig. 1(a) and (b), a demonstration model (Cessna C-150) was prepared, and a SCSN was installed on the inner surface of the fuselage. The SCSN has many advantages, such as a wider coverage and low cost DAQ channel operation cost (a single channel is used). Five artificial back-surface cracks were simulated for proof-of- concept at the five locations depicted in Fig. 1(c). Cracks A and B were fabricated with a length of 15 mm and 10 mm, respectively, as copies of hidden cracks on the fuselage back-surface skin. Cracks C to E were fabricated with a length of 10 mm each as copies of fatigue cracks emanating from the rivet holes in the lab joints. All of the cracks had a depth of 0.3 mm from the back surface. Since it is hard to visualize the damage in the presence of multiple high energy sources inside the inspection area, a multi-source removal method was applied. The multi-source removal technique has two steps. First, multiple sources are automatically localized. This is done by finding the first high energy point inside the inspection area as shown in Eqs. (1) and (2). We store the location of the highest energy point, which is the location of the first sensor because only the sensor location possess the energy of this high magnitude. To find the next source lo- cation, we apply a zero mask to our previous location and find the next sensor location up to the point where all sensor locations are detected as shown in the flow chart in Fig. 2. N-1 Est (x y) = IS,, (1) ino (1) (XSL SL.) = argmax{Est(x,y)} (x,y) (2) where S,,, is the time domain signal, x, and ys, are coordinates of the sensor location, and Esi(x,y) is the energy matrix of the complete scan area. When the source locations are identified, multi-source removal masks are applied at each source location by multiplying the original raw data with a matrix mask having the same size as the scan area with a 0 value inside the radius (r) from the center at the sensor location and 1 elsewhere. Mathematically, this is represented by My= (o if (1-x/r) + (-/r) < 1 11 if (-x/r) + (-3/r) > 1 (3) The source removal algorithm was implemented in a mobile G-UPI for inspecting a target, and the inspection results, which include a video clip of the multisource ultrasonic wave propagation imaging (mUWPI) video clip and a multi-time-frame ultrasonic energy map (mUEM) [13], are presented in Fig. 3. Fig. 3(a) shows a freeze-frame of the multi- source UWPI video clip for the entire scan area. All MSCs shown in Fig. 1(c) were successfully visualized by generating the scattering wave Start Acquire new signal Calculate signal energy Save in Energy matrix No All signals acquired? Yes out of the anomalous wave as enlarged freeze-frames in Fig. 3(b)-(g), which were captured at different time windows, respectively. The mUEM result with the source removal technique was adapted based on the freeze-frame results in Fig. 3(b)-(g). This method has the advantage Get Max. energy point Zero masking All sensor locations acquired? Save location of a fast and automatic multiple source location and removal, which not only helps to realize the damage in the presence of a strong source but also enables the enlargement of the inspection area. Moreover, damage that is visible in different time frames can be visualized in a single map No end Fig. 2. Flowchart for automatic multi-source location identification. Yes 200 150 100 50 Vertical Axis (mm) 0 (mm) (a) 200 100 8 (h) 50 25 100 200 100 11.5x4.8 mm 300 B (d) Sources removed 200 300 13.6x5.6 mm 400 E (e) 500 C 600 (1) 700 600 $ 500 800 400 Horizontal Axis (mm) 50 50 50 50 4.7x9.7 mm 9,7x8.7 mm 25 25 25 25 0 0 0 25 50 0 25 50 0 25 50 0 25 50 0 25 50 Fig. 3. UWPI freeze frames at (a) 16.0 us of the overall area, (b) 21.6 us for crack A, (c) 21.6 us for crack B, (d) 27.2 us for crack E, (e) 37.7 us for crack C, (f) 37.6 us for crack D, (g) 66.4 us for crack C, and mUEM results (h) of the overall area, (i) detected damage dimensions for cracks A-E. 296 D 700 5x7.9 mm 800 (9) (mm) 900 900 20 1400 1200 1000 800 600 400 200 50k 100k 200k 250k 10k 150k Total Scan Points 40k 90k 160k 250k Number of points in scan area Fig. 4. Performance graphs for the mUEM method. (a) Processing time vs. number of scan points to process mUEM with four time frames, (b) Time taken to find eight sensor locations for various scan points. without spending any additional processing time on the UEM result. Fig. 3(h) and (i) show the UEM result within the overall scan area and the enlarged images for each MSC, respectively. Consistent sizing for all of the detected MSCs were implemented based on a threshold method [12]. This image result provides a far clearer visibility for detected MSCs because the locations of the MSCs are able to be recognized im- mediately from the surrounding area in a single image map. For this study, the mUEM was implemented in field programmable gate array (FPGA)-based processing hardware. FPGA has the advantage of performing multiple operations simultaneously. Fig. 4 shows the performance graphs for the mUEM. Fig. 4(a) shows that the parallelism offered by FPGA accelerated the mUEM results by processing 100,000 scan points in less than 9s. Similarly, it requires almost 0.5 s to find 8 sensor locations in the scan area having 100,000 points as shown in Fig. 4(b). This acceleration is made possible by performing parallel processing for multi-dimensional Fourier transform, source removal, and multi-time-frame wave energy computations. stored laser scanned signals are processed by exactly the same filtering process, and each processed laser impact signal and the processed mechanical impact signal are compared via cross correlation. Each cross-correlation coefficient is divided by the geometric mean of the first norm value of each signal to eliminate the error caused by the amplitude difference depending on the propagation distance. Maximum coefficient values are extracted and mapped on the scanned area. The raw cross correlation map is still noisy, and a spatial averaging is ap- plied to smooth the map. Fig. 6 is the final cross correlation map, and (96, 73) is detected as the impact location where another second peak is shown in the right side of the map. The coefficient is smaller than that of the detected impact location. Since the SCSN is actually a single channel with multiple sensing elements, high coefficients are symme- trically observed with respect to the sensor locations. However, since the reflected waves on the left and right sides are different, one of the two sides has a higher coefficient. Therefore, the signal channel system is sufficient for this algorithm to localize the impact event. 5 Total Processing Time (s) Processing time (milliseconds) O 2.2. Q-switched laser training for impact event localization Conventional impact localization techniques have been studied with multiple data acquisition channels for multiple transducers. Acoustic emissions induced by an impact are mostly utilized for extracting ar- rival time differences or similarity comparison with pre-training signals [14,15]. A laser scanning application, which is introduced in this sec- tion, is also equipped with the identical G-UPI system for pre-training of the target structure shown in Fig. 1(a) and (b). Advantages of laser- based training are the high reliability and repeatability of the training data and the significant decrease in training time compared with manual training via manpower. Furthermore, the training data are easily modulated up to the characteristics of real impact signals because laser ultrasonic signals are composed of a broad range of frequency components. Training data are acquired and stored by performing laser pulse scanning using the G-UPI system onto the target structure, which is embedded with the SCSN. This SCSN captures not only training data but also impact-induced signals. Fig. 5 shows the impact localization al- gorithm with the laser-based training technique, which is triggered as soon as the impact signal is detected. After the training is completed, the SCSN passively monitors any impact-induced signal. During event monitoring, a high-pass filter is used to isolate high-frequency signals from parasite vibrations, and a low-pass filter is also used together to reject high-frequency noise. Once an impact wave is detected, its spectrum is obtained by fast Fourier transform and enveloped to find the central frequency of f. A certain band centered on f, is further numerically band-pass filtered one more time because a narrower band provides a more accurate comparison with laser impact signals. The Fig. 7 and Table 1 present the experimental results of the impact lo- calization with laser-based training data and the SCSN. Table 1 includes the coordinates of attempted and detected locations within the scan area and errors in distance for each attempt, and Fig. 7 is a grid plot showing the attempted impact locations and detected impact locations. Twenty arbitrary impacts were applied onto the front surface of the Cessna-150 fuselage structure, within the identical area depicted in Figs. 1 and 3. Laser-based training was also implemented with a spatial interval of 1 mm, and all of the laser-induced signals were filtered through an analogue programmable filter within the band-pass filtering range of 5-180 kHz. As shown in Table 1, all trials were localized with small errors within a distance of 3.61-7.1 mm. According to the results, laser-based training is clearly able to provide training data with a high spatial resolution of complex structures. 3. Smartification of the wing structure The UPI system mentioned in Section 2 has many advantages, such as a rapid inspection speed and non-contacting scanning. Long distance scanning is also one advantage of the UPI system. This ability is ac- complished by collimating the laser beam using beam expanders [16]. The Smart Hangar, which is for the proof-of-concept of the SHM system for in-service aircraft structures, was built with a multi-area scanning G- UPI system and a long distance scanning configuration as shown in Fig. 8 [17]. The system, which was built in the smart hangar, is capable of both long distance and dual area scanning via optical collimators, and the two tilting mirror systems were installed into the ceiling of the building. Laser scanning was implemented on two different areas si- multaneously, and all generated ultrasonic signals were stored Start (Event detection) Band-pass filtering in AE regime. FFT and find the central freq. fe Narrow band-pass filtering for cross-correlation (f. 1 kHz) between event and laser spectra Cross-correlation between event and laser signals, in time domain Fig. 5. Flow chart of the impact localization algorithm with laser-based training. Laser scanned training set separately. This system is also able to be utilized for SHM and laser- based training as mentioned in Section 2. Long distance and dual area scanning allows for inspections or training in inaccessible areas such as the upper skin of wing structure. In the previous smartification methods, the PZT transducers are mostly used to convert general structures into smart structures. The FBG sensor is also an important selection for aircraft SHM depending on the application. Since FBG sensors are very thin and light, they can be easily embedded into structures. Furthermore, FBG sensors have im- munity from electro-magnetic, high-intensity radiated fields, and tran- sient signal interference or potential jamming; thus, they are widely used in SHM of specific structures that are equipped with various Cross-correlation coefficient map with spatial averaging Take maximum coefficient location as the event location Display location microcontroller, which is for modulating the pulse width of the input signal [19]. Twelve motors represent the wing displacement in upward and downward directions, respectively, and the other seven motors corresponding to seven arbitrary divisions on the leading edge of the wing. In this system, four FBG sensors were installed onto a half wing specimen with an aluminum alloy, to measure the dynamic strains. FBG spectra were measured using an interrogator [20]. As shown in Fig. 11, the installed FBG sensors and the interrogator captured the wavelength shift from each FBG sensor that was caused by deflection or impact. This section describes the smartification of UAV structures using FBG sensors and a pilot arm-wearable haptic interface. The system accomplishes its objective via human-robot interactions by acquiring spectral variations caused by deflection or impaction on the wing structures. In general, ground pilots monitor massive amounts of in- formation from UAVs through the auditory or visual senses. If the ground system feeds too much information to the pilots in the tradi- tional manner, it may reduce the multitasking efficiency of ground pi- lots. As an alternative sense for transferring extra information, the tactile sense is the fastest way to transfer any information to the human brain. Fig. 9 shows a concept for a SHM system for a UAV wing structure. The objective of the system is to allow the ground pilot to recognize information about the structural health via stimulation from the arm-wearable interface and allow ground pilots make decisions themselves. Fig. 10 shows the arm-wearable haptic interface for sti- mulating human subjects. A total of nineteen vibro-motors were at- tached on an arm sleeve, and all vibro-motors were connected to a The first step of estimating wing deflection from wavelength shifts is a strain calculation from the wavelength shifts. Wing deflection dis- placement is estimated based on the strain data using a dis- placement-strain transformation matrix [21]. Six pieces of wing dis- placement data for certain locations were extracted from the resultant matrix of the above estimation process and were converted into eight bits of binary data to be transferred to each corresponding vibro-motor onto the arm-wearable haptic interface. Positive wing deflection dis- placements were allocated within the range of 254-128, and negative wing deflection displacements were allocated within the range of 128-0, where zero displacement is 127 in the binary form. Finally, the six pieces of converted binary data for each location were transmitted to the haptic interface using a trigger signal, which is 255 for syn- chronization with the UAV wing deflection information. Human subject testing was performed to verify the feasibility of the proposed system. The first test was performed to verify that wing de- flection information is recognizable to the participants. Fifteen 0 50 100 150 200 Table 1 Impact localization results for the twenty attempts (Coordinates and distance errors). Location 1 (100, 70] Location 2 [300, 100) Detected location Error in Distance Detected location Error in Distance [98, 73] [296, 106] 7.21 3.61 5.39 [98, 75] [301, 104] 4.12 [98, 73] 3.61 [295, 106] 7.81 [96, 76] 7.21 [299, 105] 5.10 [96, 73] 5.00 [297, 107] 7.62 1 2 3 4 5 *Attempted impact locations =: Detected impact locations . PZT patches 200 500 600 Fig. 7. Impact localization results for twenty attempts (Grid plot). Location 3 [500, 130] Detected location [499, 126] [500, 126] [498, 126] [499, 127] [497, 126] Error in Distance 6.08 6.00 6.32 7.07 6.71 Location 4 (850, 190) Detected location [847, 187] [848, 185) [849, 187] [851, 183] [851, 186) Error in Distance 7.62 5.39 7.07 3.16 6.08 participants were given a brief instruction regarding the arm-wearable haptic interface, and each participant conducted arbitrary wing de- flection detection tests 10 times. All tests were conducted as blind tests. All participants were able to sense downward or upward deflection information 100% for 150 deflection testing times. 3.2. Impact localization Wavelength shifts caused by an impact event are transferred through the serial communication and go through an impact localiza- tion algorithm. Seven imaginary areas are defined as shown in Fig. 12; thus, an index of area where the event location is included is trans- mitted to the arm-wearable haptic interface. It is assumed that all im- pact locations are at the leading edge of the wing structure because impact events occur while the UAV is operating; thus, the algorithm will solve simple linear equations. Fig. 13 shows the impact localization algorithm on the leading edge. The algorithm detects the arrival time of the signal from each FBG sensor based on Akaike information criterion (AIC) [22], AIC (1,k) = klogvar (s[1,1: k]) + N-k-1logvar (s [L,k + 1: N]) (4) where i and k are indices of the FBG sensors and the length of the discrete wavelength data, respectively, and s isi x N of the wavelength shifts from the interrogator. AICs are calculated for each wavelength shift, and they are used for determining the global arrival time, ATC, i.e., argmin AIC (1,k) *A t= ATC (1) (5) where At is the sampling interval of a discrete wavelength shift. The algorithm searches the minimum ATC, that corresponds to the ATC of the first arrival wavelength shift used for self-triggering. Thus, the re- levant arrival time of AAT, is calculated as AAT (1) = AT (1)-min{ATC) (6) Relevant distance differences (D) are estimated by multiplying the wave propagation speed in shear (V) or longitudinal (V) to the relevant arrival times, and they are compared with relevant distance differences calculated from the structural geometry (D). As a result of the com- parison, M(i), the coordinates along the x-axis, with the smallest errors in distance are stored, and Mag, a mean value of all detected M values is printed as the final result of the localization process. The arm- wearable interface receives an index of area, which corresponds to the location, Mag, and stimulates human subjects according to the Fig. 10. An arm-wearable interface with vibro-tactile motors and micro- controller for impact monitoring. localization result. A second test was also performed to verify that participants are able to distinguish the impact localization results. Seven impacts were ap- plied on seven different locations corresponding to specific locations in each area. Note that all impacts were applied along the edge of the half- wing specimen to simulate an impact event on the leading edge. Table 2 shows the localization results and answers from a participant for all of seven attempts. The algorithm succeeded to localized event locations correctly in all attempts with distance errors from 9.3 mm to 24.2 mm. A participant received information through the arm-wearable interface and made identical decisions to the algorithm output results. 4. Conclusion Aircraft SHM has become essential to reduce the budget and time required for guaranteeing structural safety. Four SHM technologies and their real-world implementation strategies were proposed in this paper. The mobile G-UPI system and SCSN was applied for Cessna-150 fu- selage smartification. The laser pulses from the mobile G-UPI system performed an inspection of a large area that was smartified by the SCSN. Thus, the system was able to perform MSC monitoring and laser- based structure training by presenting crack visualization and impact localization results. This technique showed its potential to smartify in- service aircraft structures under the SHM scheme. A FBG sensor-based SHM system also has been introduced as a SHM solution for UAV. Wavelength shifts were measured by FBG sensors and were used to 114.30 mm FBG4 A6 A7 AAT Input 1-1 ; (!) # 0 ? Yes Nearby the Min. AAT? Yes AAT (1) S 20 s? Yes Drei (1) -MATG (1)*V, Dret (1) =AATG (1)*V, arg min (abs ((Deo(i, m)) - Dret())) - Ax = M (1) m FBG3 A4 A3 A2 Impact at Area 6 Fig. 12. Defined imaginary areas on the half-wing specimen. Is M() within the range? Yes No No No FBG2 57.15 mm, FBG1 Leading Edge i-i+1 M(1)-NaN No No i=4? Yes Averaging all detected M Print area index. corresponding to the Marg Note: Ax=spatial interval on the leading edge, along to the x-axis m: indices, [1:wing span/Ax] Composite Airplanes, United States Government Accountability Office, Washington DC, USA, 2011, [2] K. Armstrong, L. Bevan, W. Cole, Care and Repair of Advanced Composites, Second ed., SAE International, Warrendale, USA, 2005. calculate deflection or impact locations. The arm-wearable haptic in- terface stimulated participants based on the estimated deflection or localization results. In the human subject testing, all participants were able to recognize the vibrations clearly from the wearable interface and make their own decisions based on the transmitted information. In the future, these suggested systems will contribute to reducing the oper- ating expenses for in-service commercial aircraft or UAVs. [3] P. Jakab, Wood to metal: the structural origins of the modern airplane, J. Aircraft 36 (1999) 914-918. [4] C. Sbarufatti, A. Manes, M. Giglio, Application of sensor technologies for local and distributed structural health monitoring, Struct. Control Health Monit. 21 (2014). 1057-1083. Acknowledgments [5] J. Menda, J.T. Hing, H. Ayaz, P.A. Shewokis, K. Izzetoglu, B. Onaral, P. Oh, Optical brain imaging to enhance UAV operator training, evaluation, and interface devel opment, J. Intell. Robot. Syst. 61 (1-4) (2011) 423-443. This work was supported by the Technology Innovation Program (10074278) funded by the Ministry of Trade, Industry & Energy (MI, Korea). [6] T.E. Noll, J.M. Brown, M.E. Perez-Davis, S.D. Ishmael, G.C. Tiffany, M. Gaier, Investigation of the Helios Prototype Aircraft Mishap volume I mishap report, NASA Langley Research Center, USA, 2004. [7] F.LD. Scalea, H. Matt, L. Bartori, S. Coccia, G. Park, C. Farrar, Health monitoring of UAV wing skin-to-spar joints using guided waves and macro fiber composite transducers, J. Intell. Mater. Syst. Struct. 18 (4) (2007) 373-388. References [8] CY. Park, B.W. Jang, J.H. Kim, C.G. Kim, S.M. Jun, Bird strike event monitoring in a composite UAV wing using high speed optical fiber sensing system, Compos. Sci. Technol. 72 (4) (2012) 498-505. [1] G.L. Dillingham, Aviation Safety-Status of FAA's Actions to Oversee the Safety of [9] J. He, X. Guan, T. Peng, Y. Liu, A. Saxena, J. Celay, K. Goebel, A multi-feature 201
Step by Step Solution
★★★★★
3.44 Rating (163 Votes )
There are 3 Steps involved in it
Step: 1
Introduction There is a need of composite materials in aerosols industries for benefit and it is increasing day by day There are many advantages of using composite materials in aerospace engineering T...
Get Instant Access to Expert-Tailored Solutions
See step-by-step solutions with expert insights and AI powered tools for academic success
Step: 2

Step: 3

Ace Your Homework with AI
Get the answers you need in no time with our AI-driven, step-by-step assistance
Get Started


