

Question
Q2. Pearson's Correlation (15 points) ( Round calculated results to the hundredth (2 nd place to the right of the decimal) when result extends beyond
Q2. Pearson's Correlation (15 points) (Round calculated results to the hundredth (2ndplace to the right of the decimal) when result extends beyond that unless otherwise noted).
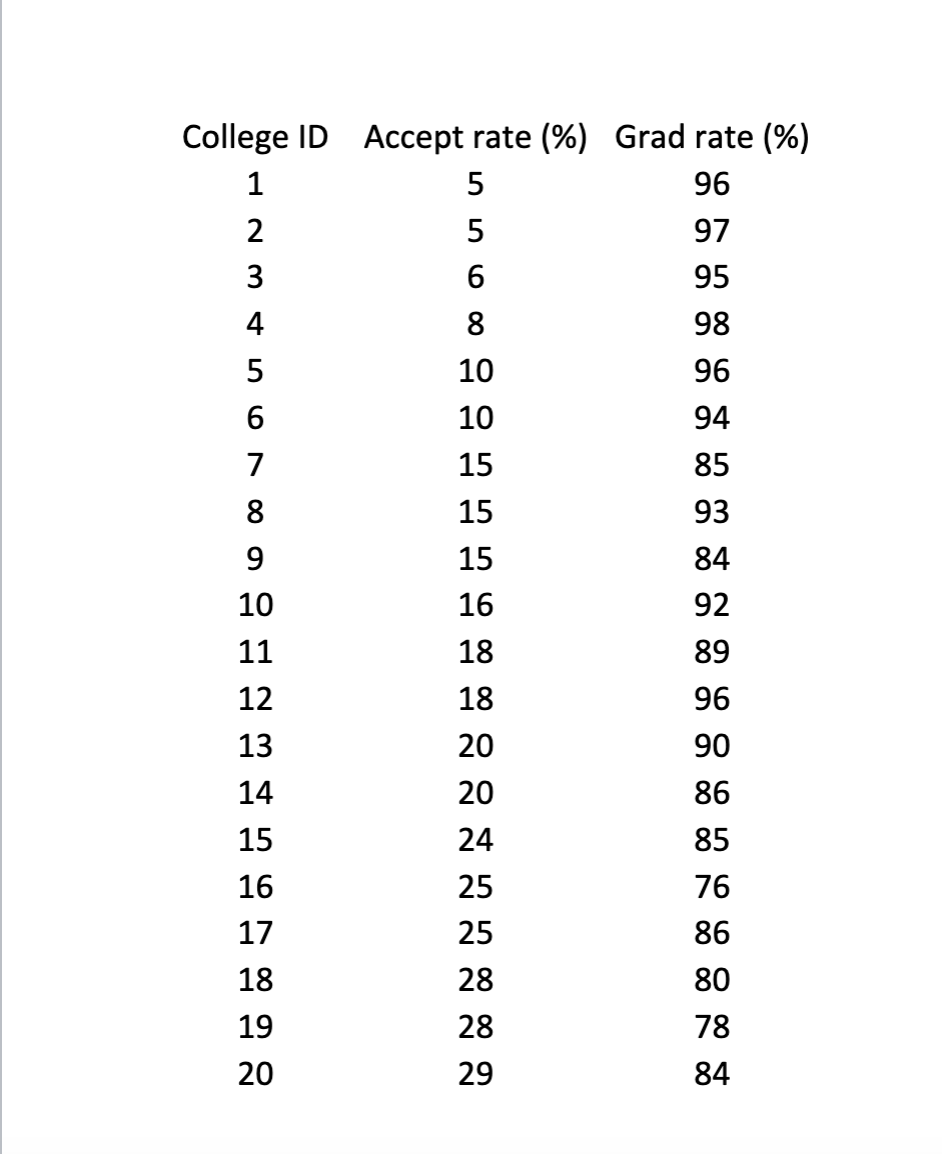
It is generally believed that there is a relationship between a college's acceptance rate and its graduation rate. I wanted to know how strong this relationship is within the top universities in the country, so I collected the graduation rate and acceptance rate data of a randomly selected sample of universities from all the top U.S. universities (with an acceptance rate at or below 30%). The data set is in Tab Q2 of the Excel data file.
Q2a. Make a scatter plot between the two variables using Excel. Paste the plot here and format it into an APA "figure" (see Assignment Guides for APA ).Be sure to submit the Excel file that you used to create the scatter plot.
- 0.5 for correct scatter graph type
- 0.5 for the two axis labels (deduct 0.5 even if only one label is missing)
- 0.5 for APA (figure number and caption at bottom, figure number is italic)
- 0.5 for correct data from the two variables on the X and Y axes
Paste Table Here:
|
Q2b. Calculate the mean and standard deviation for the two variables separately.
Q2c. Calculate the Z scores for all the scores of the two variables, separately.Tips: It may help to prevent error and to increase clarity if the process and/or the answers (z scores) are listed in a table format.
Q2d. Calculate Pearson's correlation coefficientr.
Q2e. Explain the direction and strength of the relationship based on ther.
Q2f. What is the proportion of variance shared between the two variables? (That is, how much of the variance in one variable can be predicted by the variance in the other variable?) (Do not round during the calculation, the final result as thepercentageshould be to the hundredth [2nddecimal])
Q2g. If the researcher wants to perform a two-tailed hypothesis test using this data set so that she can generalize the relationship between the two variables from the sample to the population, what would be the null and alternative hypothesis? Write the hypotheses in words and in symbol notation.
| Written | Symbolic Symbol bank for copy & pasting: =mr | |
| Null | H0: | |
| Alternative | H1: |
Q2h. Using SPSS to analyze the same dataset yields apvalue of .031. Based on ? = .05, what would be the conclusion of the hypothesis test (use wording of "reject the null hypothesis" or "fail to reject the null hypothesis"? How do you know?
Step by Step Solution
There are 3 Steps involved in it
Step: 1

Get Instant Access to Expert-Tailored Solutions
See step-by-step solutions with expert insights and AI powered tools for academic success
Step: 2

Step: 3
Ace Your Homework with AI
Get the answers you need in no time with our AI-driven, step-by-step assistance
Get Started
Discrete and Combinatorial Mathematics An Applied Introduction
Authors: Ralph P. Grimaldi
5th edition
201726343, 978-0201726343