Answered step by step
Verified Expert Solution
Link Copied!

Question

1 Approved Answer

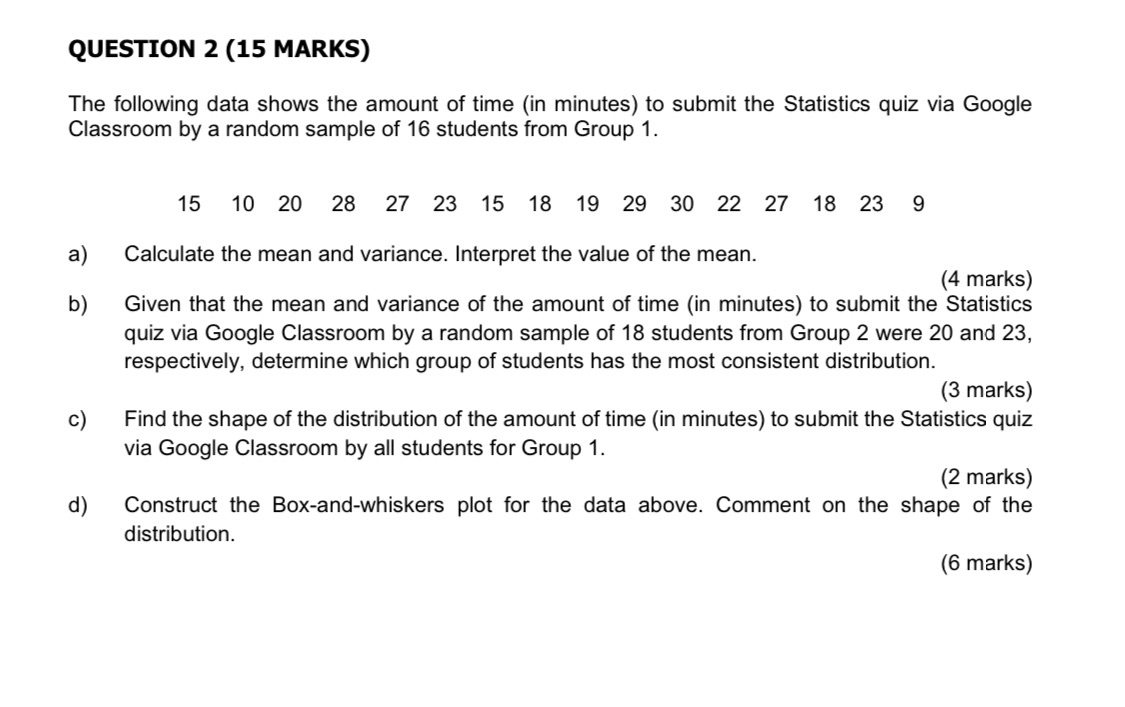
Q)2 QUESTION 2 (15 MARKS) The following data shows the amount of time (in minutes) to submit the Statistics quiz via Googie Classroom by a

image text in transcribed

Q)2

image text in transcribed
QUESTION 2 (15 MARKS) The following data shows the amount of time (in minutes) to submit the Statistics quiz via Googie Classroom by a random sampie of 16 students from Group 1. d) 15 1020 28 27231518192930222718239 Calculate the mean and variance. Interpret the value of the mean. (4 marks) Given that the mean and variance of the amount of time (in minutes) to submit the Statistics quiz via Google Classroom by a random sample of 18 students from Group 2 were 20 and 23, respectively. determine which group of students has the most consistent distribution. (3 marks) Find the shape of the distribution of the amount of time (in minutes) to submit the Statistics quiz via Googie Classroom by ail students for Group 1. (2 marks) Construct the Box-and-whiskers plot for the data above. Comment on the shape of the distribution. (6 marks)

Step by Step Solution

There are 3 Steps involved in it

Step: 1

blur-text-image

Get Instant Access to Expert-Tailored Solutions

See step-by-step solutions with expert insights and AI powered tools for academic success

Step: 2

blur-text-image

Step: 3

blur-text-image

Ace Your Homework with AI

Get the answers you need in no time with our AI-driven, step-by-step assistance

Get Started

Recommended Textbook for

Fundamentals Of Statistics

Authors: Michael Sullivan III

4th Edition

978-032184460, 032183870X, 321844602, 9780321838704, 978-0321844606

Students also viewed these Mathematics questions

Question

What is the purpose of a literature hierarchy?

Answered: 1 week ago

Question

Make eye contact when talking and listening

Answered: 1 week ago

Question

Do not go, wait until I come

Answered: 1 week ago

Question

Pay him, do not wait until I sign

Answered: 1 week ago