

Answered step by step
Verified Expert Solution
Question
1 Approved Answer
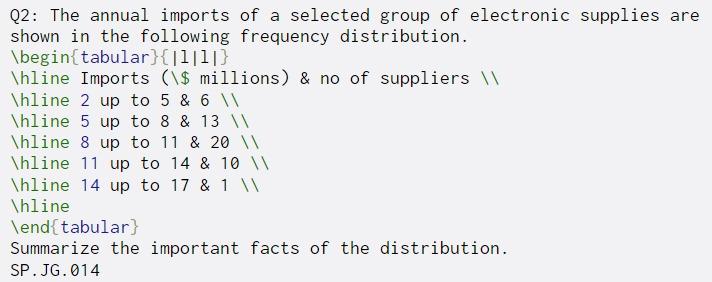
Q2: The annual imports of a selected group of electronic supplies are shown in the following frequency distribution. begin{tabular}{]1[1]} hline Imports ($ millions) & no
Step by Step Solution
There are 3 Steps involved in it
Step: 1

Get Instant Access to Expert-Tailored Solutions
See step-by-step solutions with expert insights and AI powered tools for academic success
Step: 2

Step: 3
Ace Your Homework with AI
Get the answers you need in no time with our AI-driven, step-by-step assistance
Get Started
Oracle 12c SQL
Authors: Joan Casteel
3rd edition
1305251032, 978-1305251038