Question
Write a MATLAB script called sincplot.m to plot the function sin x y = x in the range pi/100 to 10pi at intervals of

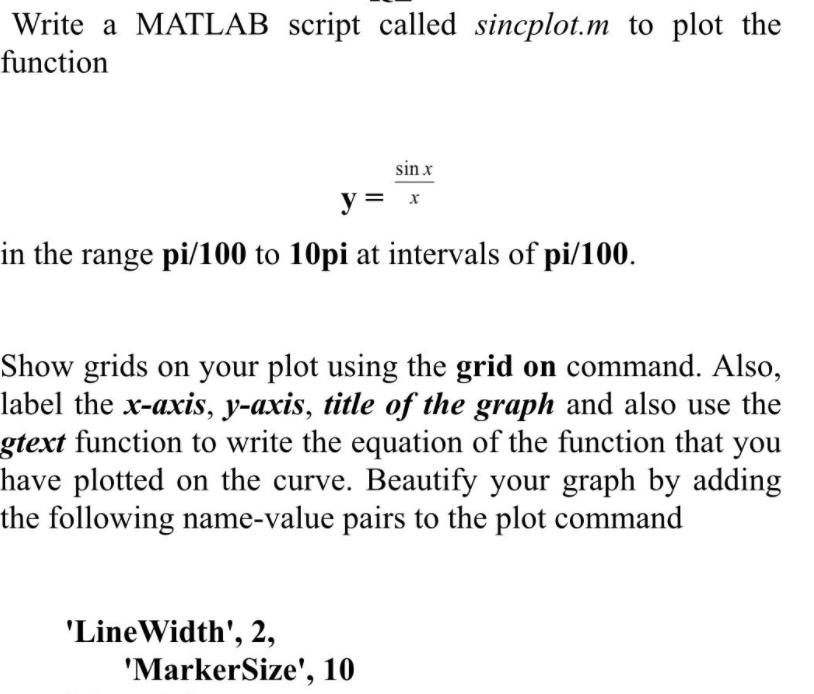
Write a MATLAB script called sincplot.m to plot the function sin x y = x in the range pi/100 to 10pi at intervals of pi/100. Show grids on your plot using the grid on command. Also, label the x-axis, y-axis, title of the graph and also use the gtext function to write the equation of the function that you have plotted on the curve. Beautify your graph by adding the following name-value pairs to the plot command 'LineWidth', 2, 'MarkerSize', 10
Step by Step Solution
There are 3 Steps involved in it
Step: 1
MATLAB Code x pi100pi10010pi y ...
Get Instant Access to Expert-Tailored Solutions
See step-by-step solutions with expert insights and AI powered tools for academic success
Step: 2

Step: 3

Ace Your Homework with AI
Get the answers you need in no time with our AI-driven, step-by-step assistance
Get StartedRecommended Textbook for
Electric Machinery
Authors: Charles Kingsley, Jr, Stephen D. Umans
6th Edition
71230106, 9780073660097, 73660094, 978-0071230100
Students also viewed these Computer Engineering questions
Question
Answered: 1 week ago
Question
Answered: 1 week ago
Question
Answered: 1 week ago
Question
Answered: 1 week ago
Question
Answered: 1 week ago
Question
Answered: 1 week ago
Question
Answered: 1 week ago
Question
Answered: 1 week ago
Question
Answered: 1 week ago
Question
Answered: 1 week ago
Question
Answered: 1 week ago
Question
Answered: 1 week ago
Question
Answered: 1 week ago
Question
Answered: 1 week ago
Question
Answered: 1 week ago
Question
Answered: 1 week ago
Question
Answered: 1 week ago
Question
Answered: 1 week ago
Question
Answered: 1 week ago
Question
Answered: 1 week ago
Question
Answered: 1 week ago
Question
Answered: 1 week ago
View Answer in SolutionInn App


