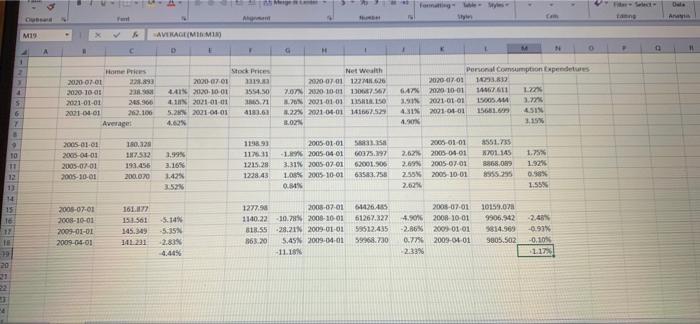
Q3 Ch 12 (15%) Go to the St. Louis Federal Reserve FRED database and find data on house prices (SPCSORSA), stock prices (SP500), a measure of the net wealth of households (TNWBSHNO), and personal consumption expenditures (PCEC). For all four measures, be sure to convert the frequency setting to "Quarterly." Download the data into a spread- sheet and make sure the data align correctly with the appropriate dates. For all four series, for each quarter, calculate the annualized growth rate from quarter to quarter. To do this, take the current-period data minus the previous-quarter data and then divide by the previous quarter data. Multiply by 100 to change each result to a percent and multiply by 4 to annualize the data. a. For the four series, calculate the average growth rates over the most recent four quar- ters of data available. Comment on the relationships among house prices, stock prices, net wealth of households, and consumption as they relate to your results. 1 b. Repeat part (a) for the four quarters of 2005, and again for the period from 2008:03 to 2009:Q2. Comment on the relationships among house prices, stock prices, net wealth of households, and consumption as they relate to your results, before and during the crisis. c. How do the current household data compare to the data from the period prior to the financial crisis, and during the crisis? Do you think the current data are indicative of a bubble? 22 DE GE KEEZE NSITE 1.17 -0.101 2009-01-01 TEZ THE 2009-06-01 3905.502 5814.969 9906.942 0.779 -2.86% -2.83 -5035 TE 12 -0.99 TD-TO-OOR TO-10-GOOZ NIZ BC 145.349 59968.730 59512.435 61267.322 142685 TO-TO-6002 5.45 2009-04-01 16320 $13.55 1140.221078 2008-10-01 1227.50 NOST TOS EST 91 2008-10-01 2005-07-01 2008-10-01 2005-07-01 WOSTOT 10-20-000 161.17 155 14 13 12 SUSE 1.55% 0.90% 1.926 2.02% 255% 2005 10-01 2005-07.01 1.42% 55.255 8868089 OM 10% 2005-10-01 3.31% 2005 07 01 200.00 TO OE-spot 63583.758 62001.00 60075.17 NOTE w 10-VO-COOK 292 11 LO - TO O-Soot WRT TO-TO-COOT 1228.43 1235.28 11711 1108 2005-0201 20-04-03 WAT SVE TO SPET CESERT SEOSE 1. TO O TO-TO-SOC 3551.735 2005 01-01 SETES 6 NO 4.60 7 WSTE NIS 1.MN 4.31% 1.27% 2001-04-01 141662.53 4183.63 9 TO-VO-TOO 10-10-TRE 10-OT COM Average 262106 25.900 3020-10-01 TO FOI TO LO TO 15651. 3.7 1500540 14667 2020-17.01 Personal consumption Expenditures L'OWE TO DO IZOE IS TD-ID-TO NIE 10 0 C I 5 MIST WV OG NETO TO TOOL NA 16 OTOK 99 WWEL DOO 647 NET E F CESEGON 1554.50 2020-07-01 Stock Price STEE E63 TO-O ONE Not wealth Home Prices 1 11 0 N + D AVERAGE(MIMI) A M19 Dule Formatting W Q3 Ch 12 (15%) Go to the St. Louis Federal Reserve FRED database and find data on house prices (SPCSORSA), stock prices (SP500), a measure of the net wealth of households (TNWBSHNO), and personal consumption expenditures (PCEC). For all four measures, be sure to convert the frequency setting to "Quarterly." Download the data into a spread- sheet and make sure the data align correctly with the appropriate dates. For all four series, for each quarter, calculate the annualized growth rate from quarter to quarter. To do this, take the current-period data minus the previous-quarter data and then divide by the previous quarter data. Multiply by 100 to change each result to a percent and multiply by 4 to annualize the data. a. For the four series, calculate the average growth rates over the most recent four quar- ters of data available. Comment on the relationships among house prices, stock prices, net wealth of households, and consumption as they relate to your results. 1 b. Repeat part (a) for the four quarters of 2005, and again for the period from 2008:03 to 2009:Q2. Comment on the relationships among house prices, stock prices, net wealth of households, and consumption as they relate to your results, before and during the crisis. c. How do the current household data compare to the data from the period prior to the financial crisis, and during the crisis? Do you think the current data are indicative of a bubble? 22 DE GE KEEZE NSITE 1.17 -0.101 2009-01-01 TEZ THE 2009-06-01 3905.502 5814.969 9906.942 0.779 -2.86% -2.83 -5035 TE 12 -0.99 TD-TO-OOR TO-10-GOOZ NIZ BC 145.349 59968.730 59512.435 61267.322 142685 TO-TO-6002 5.45 2009-04-01 16320 $13.55 1140.221078 2008-10-01 1227.50 NOST TOS EST 91 2008-10-01 2005-07-01 2008-10-01 2005-07-01 WOSTOT 10-20-000 161.17 155 14 13 12 SUSE 1.55% 0.90% 1.926 2.02% 255% 2005 10-01 2005-07.01 1.42% 55.255 8868089 OM 10% 2005-10-01 3.31% 2005 07 01 200.00 TO OE-spot 63583.758 62001.00 60075.17 NOTE w 10-VO-COOK 292 11 LO - TO O-Soot WRT TO-TO-COOT 1228.43 1235.28 11711 1108 2005-0201 20-04-03 WAT SVE TO SPET CESERT SEOSE 1. TO O TO-TO-SOC 3551.735 2005 01-01 SETES 6 NO 4.60 7 WSTE NIS 1.MN 4.31% 1.27% 2001-04-01 141662.53 4183.63 9 TO-VO-TOO 10-10-TRE 10-OT COM Average 262106 25.900 3020-10-01 TO FOI TO LO TO 15651. 3.7 1500540 14667 2020-17.01 Personal consumption Expenditures L'OWE TO DO IZOE IS TD-ID-TO NIE 10 0 C I 5 MIST WV OG NETO TO TOOL NA 16 OTOK 99 WWEL DOO 647 NET E F CESEGON 1554.50 2020-07-01 Stock Price STEE E63 TO-O ONE Not wealth Home Prices 1 11 0 N + D AVERAGE(MIMI) A M19 Dule Formatting W


