

Answered step by step
Verified Expert Solution
Question
1 Approved Answer
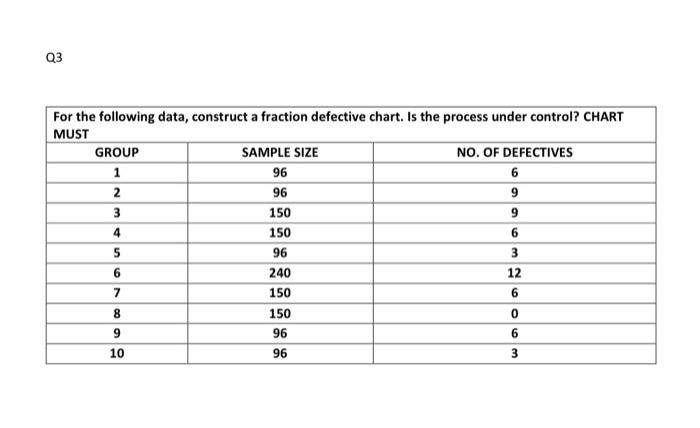
Q3 For the following data, construct a fraction defective chart. Is the process under control? CHART MUST GROUP SAMPLE SIZE NO. OF DEFECTIVES 1 96
Step by Step Solution
There are 3 Steps involved in it
Step: 1

Get Instant Access to Expert-Tailored Solutions
See step-by-step solutions with expert insights and AI powered tools for academic success
Step: 2

Step: 3
Ace Your Homework with AI
Get the answers you need in no time with our AI-driven, step-by-step assistance
Get Started
MRA/HCC Chart Review And Documentation Guide A Brief Step By Step Guide On Chart Audits For Optimal Risk Adjustment Captures
Authors: The Coders Choice LLC
1st Edition
1698476965, 978-1698476964