

Question
Q3. Hypothesis testing using a Z test (12.5 points) A professor has been teaching introductory statistics for many years and the final exam performance has
Q3. Hypothesis testing using a Z test (12.5 points)
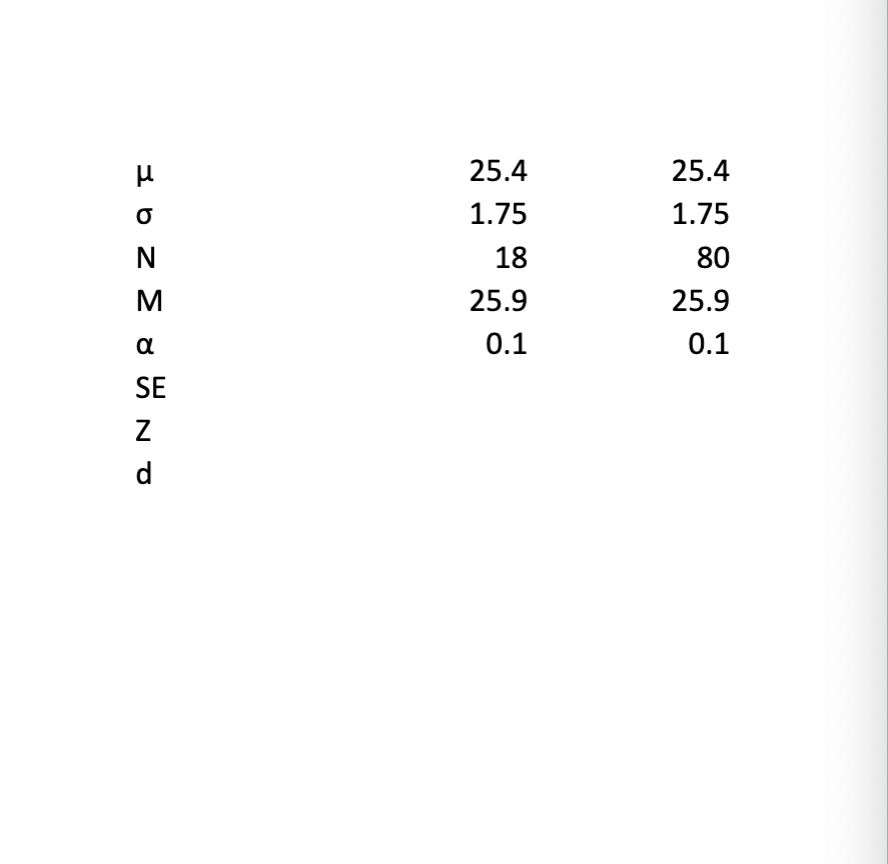
A professor has been teaching introductory statistics for many years and the final exam performance has been very consistent from class to class and the scores have been normally distributed. Overall, the whole data base (i.e., population) of final exam scores has a mean (?) of 25.4 points (out of a maximum of 30 points) and a standard deviation (?) of 1.75 points. The professor would like to revise the course design to see if student performance on the final exam could be improved.
There were 18 students who took the new course as a trial run in a recent academic year, and their average final exam score was 25.9. The professor would like to run a hypothesis test to see if this sample of students in the recent trial course performed significantly better than the past population. In other words, the hypothesis was a comparison between the population taking the course with the new design (represented by the sample of 18 students) with the population taking the course with the old design.
The professor is predicting an increase of final exam score with the new design, so the hypotheses should be directional, and the test should be one-tailed. The significance level is set at ? = .1.
Q3a. Identify the dependent variable for this study
Q3b. State the null hypothesis and alternative hypothesis using both words and symbol notation.
| Written | Symbolic Symbol bank for copy & pasting: =m | |
| Null | H0: | |
| Alternative | H1: |
Q3c. Calculate standard error (SE, which is the standard deviation of the sampling distribution)Round the result to the hundredth (2nd place to the right of the decimal).
Q3d. Calculate the Z statistic (which indicates where our sample mean is located on the sampling distribution) Round the result to the hundredth (2nd place to the right of the decimal).
Q3e. Determine the critical value for Z. Explain how you come up with the answer.
Q3f. Compare the Z statistic with the appropriate critical Z value and then draw a conclusion about the result of the hypothesis test. What is the answer to the research question?
- Do you "reject" or "fail to reject" the null hypothesis?
- What is the answer to the research question?
Q3g. Calculate the standardized effect size for this test.
Is this considered a small, medium, or large effect according to the Cohen's d standards?
Answer the following questions based on this alternative scenario:
Because a sample of 18 students is very small, it may not represent a full class adequately. So, the researcher decides to continue to collect data for another semester of the new course design until the sample becomes 80. The average new test score remains 25.9, the same as the previous scenario. All other aspects of the study remain unchanged.
Q3h. What is the standard error with this sample? Round the result to the hundredth (2nd place to the right of the decimal).
Q3i. What is the Z statistic with this sample? Round the result to the hundredth (2nd place to the right of the decimal).
Q3j. Compare the Z statistic with the appropriate critical Z value and then draw a conclusion about the result of the hypothesis test. What is the answer to the research question now?
- Do you "reject" or "fail to reject" the null hypothesis?
- What is the answer to the research question?
Q3k. Calculate the standardized effect size.
Q3l. Based on the hypothesis test results with the two samples (one with 18 subjects and the other with 80 subjects), how did the increase in sample size impact the test results in terms of the Z statistic and the effect size?
Step by Step Solution
There are 3 Steps involved in it
Step: 1

Get Instant Access to Expert-Tailored Solutions
See step-by-step solutions with expert insights and AI powered tools for academic success
Step: 2

Step: 3
Ace Your Homework with AI
Get the answers you need in no time with our AI-driven, step-by-step assistance
Get Started
Linear Algebra A Modern Introduction
Authors: David Poole
3rd edition
9781133169574 , 978-0538735452