Answered step by step
Verified Expert Solution
Question
1 Approved Answer
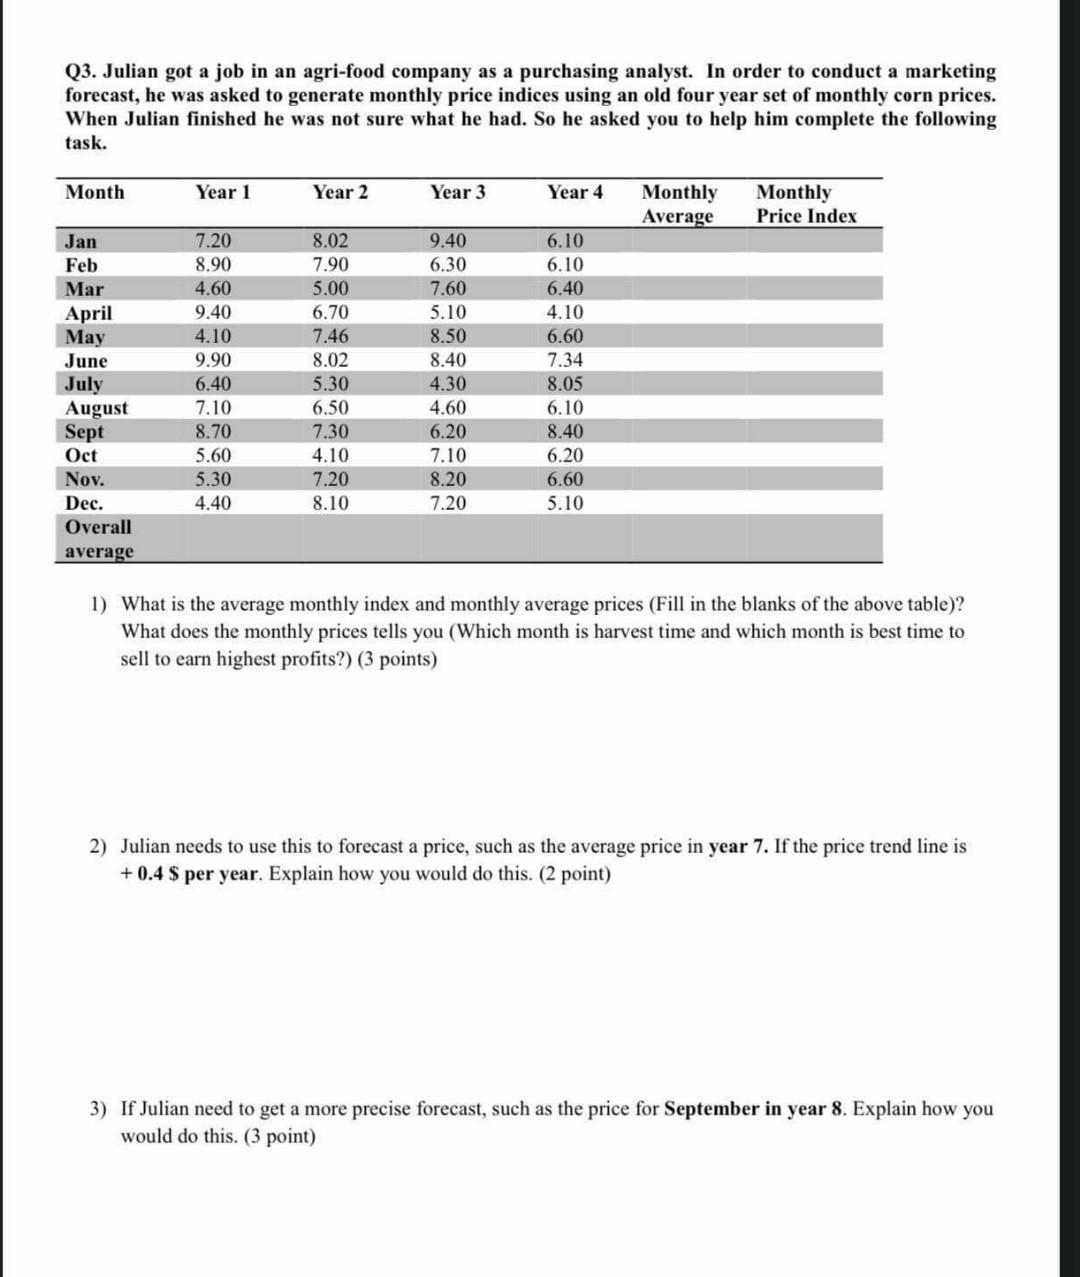
Q3. Julian got a job in an agri-food company as a purchasing analyst. In order to conduct a marketing forecast, he was asked to generate

Q3. Julian got a job in an agri-food company as a purchasing analyst. In order to conduct a marketing forecast, he was asked to generate monthly price indices using an old four year set of monthly corn prices. When Julian finished he was not sure what he had. So he asked you to help him complete the following task. Month Year 1 Year 2 Year 3 Year 4 Monthly Average Monthly Price Index Jan Feb Mar April May June July August Sept 7.20 8.90 4.60 9.40 4.10 9.90 6.40 7.10 8.70 5.60 5.30 4.40 8.02 7.90 5.00 6.70 7.46 8.02 5.30 6.50 7.30 4.10 7.20 8.10 9.40 6.30 7.60 5.10 8.50 8.40 4.30 4.60 6.20 7.10 8.20 7.20 6.10 6.10 6.40 4.10 6.60 7.34 8.05 6.10 8.40 6.20 6.60 5.10 Oct Nov. Dec. Overall average 1) What is the average monthly index and monthly average prices (Fill in the blanks of the above table)? What does the monthly prices tells you (Which month is harvest time and which month is best time to sell to earn highest profits?) (3 points) 2) Julian needs to use this to forecast a price, such as the average price in year 7. If the price trend line is +0.4 $ per year. how you would do this. (2 3) If Julian need to get a more precise forecast, such as the price for September in year 8. Explain how you would do this. (3 point) Q3. Julian got a job in an agri-food company as a purchasing analyst. In order to conduct a marketing forecast, he was asked to generate monthly price indices using an old four year set of monthly corn prices. When Julian finished he was not sure what he had. So he asked you to help him complete the following task. Month Year 1 Year 2 Year 3 Year 4 Monthly Average Monthly Price Index Jan Feb Mar April May June July August Sept 7.20 8.90 4.60 9.40 4.10 9.90 6.40 7.10 8.70 5.60 5.30 4.40 8.02 7.90 5.00 6.70 7.46 8.02 5.30 6.50 7.30 4.10 7.20 8.10 9.40 6.30 7.60 5.10 8.50 8.40 4.30 4.60 6.20 7.10 8.20 7.20 6.10 6.10 6.40 4.10 6.60 7.34 8.05 6.10 8.40 6.20 6.60 5.10 Oct Nov. Dec. Overall average 1) What is the average monthly index and monthly average prices (Fill in the blanks of the above table)? What does the monthly prices tells you (Which month is harvest time and which month is best time to sell to earn highest profits?) (3 points) 2) Julian needs to use this to forecast a price, such as the average price in year 7. If the price trend line is +0.4 $ per year. how you would do this. (2 3) If Julian need to get a more precise forecast, such as the price for September in year 8. Explain how you would do this. (3 point)
Step by Step Solution
There are 3 Steps involved in it
Step: 1

Get Instant Access to Expert-Tailored Solutions
See step-by-step solutions with expert insights and AI powered tools for academic success
Step: 2

Step: 3

Ace Your Homework with AI
Get the answers you need in no time with our AI-driven, step-by-step assistance
Get Started


