Q3 What is Company XYZ's intrinsic enterprise value under the High Case, using the WACC as the discount rate and assuming the terminal value is based on the perpetual growth rate assumption outlined on the "Control Panel" tab? A. $235,269 B. $212,976 C. $226,643 D. $207,154
E. $231,799
F. $237,597
G.$234,147
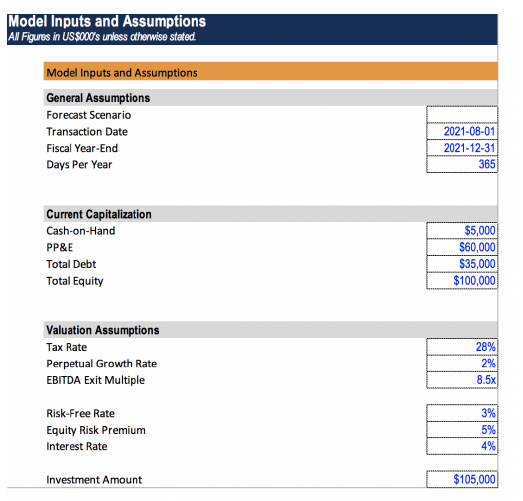
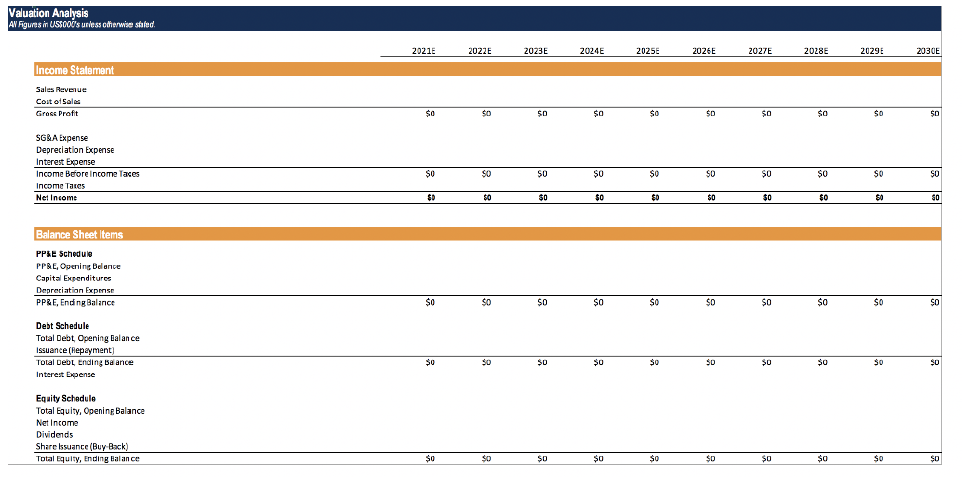
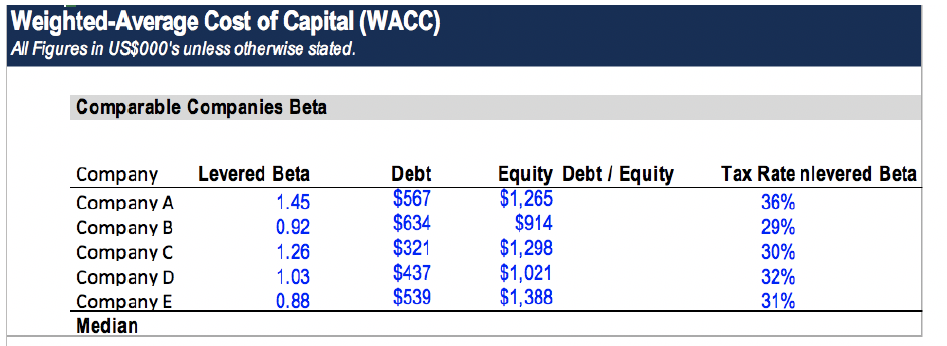
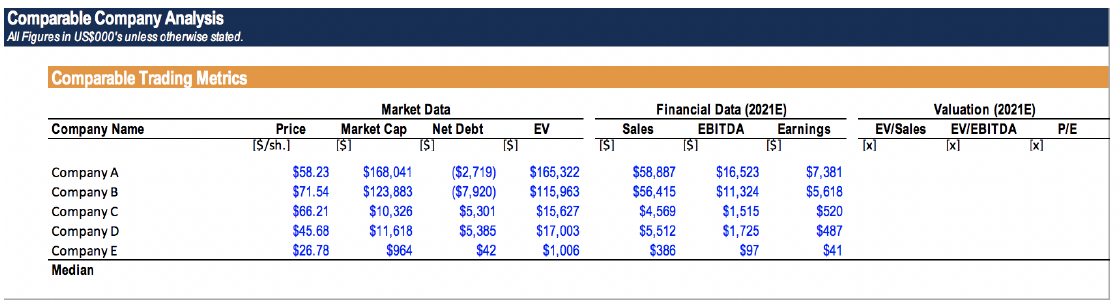
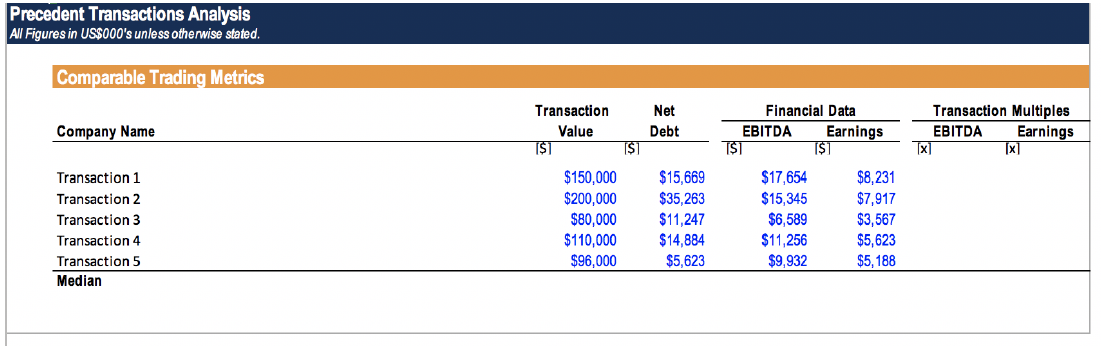
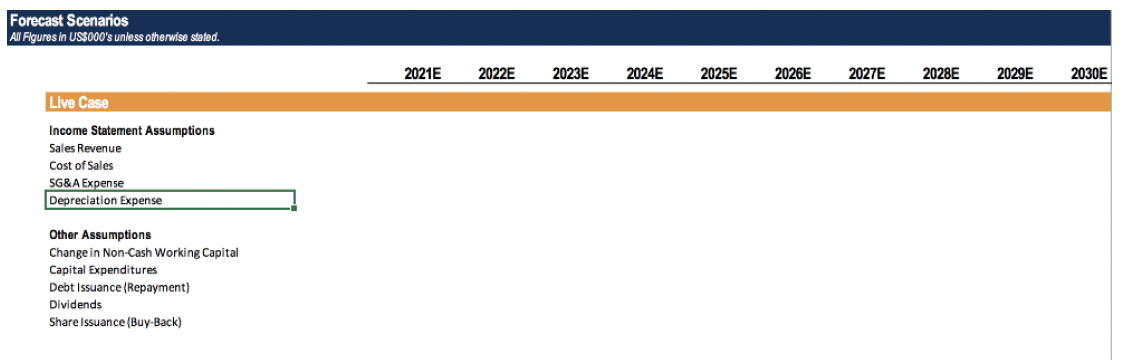
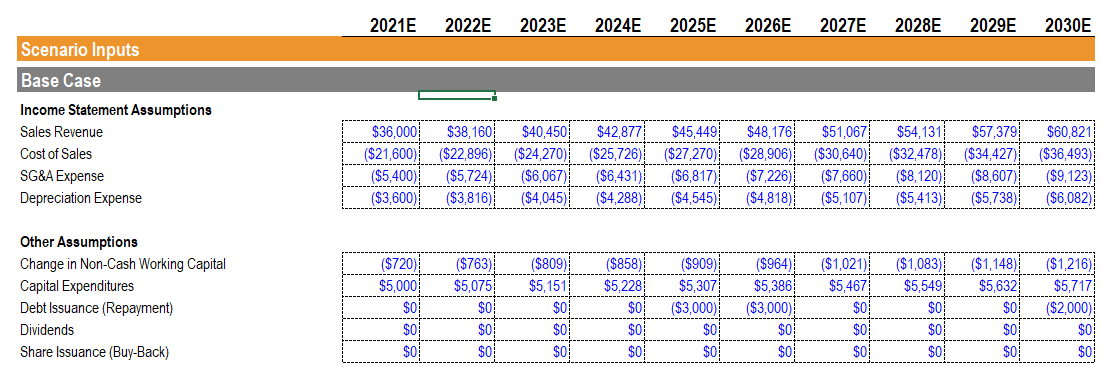
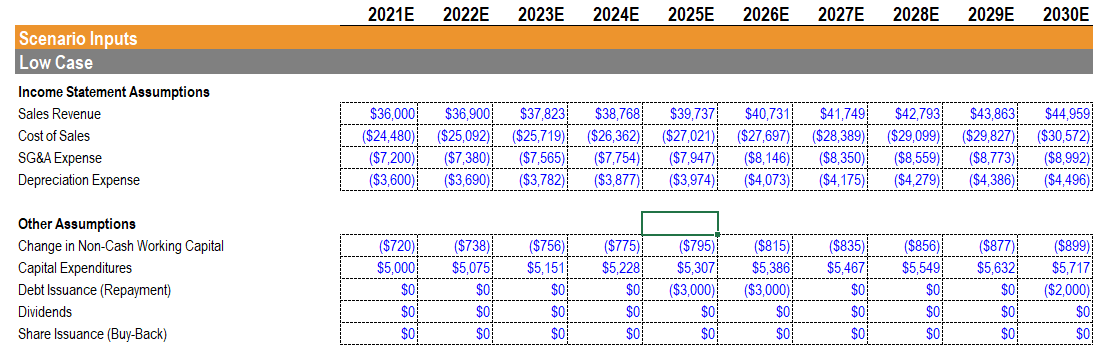
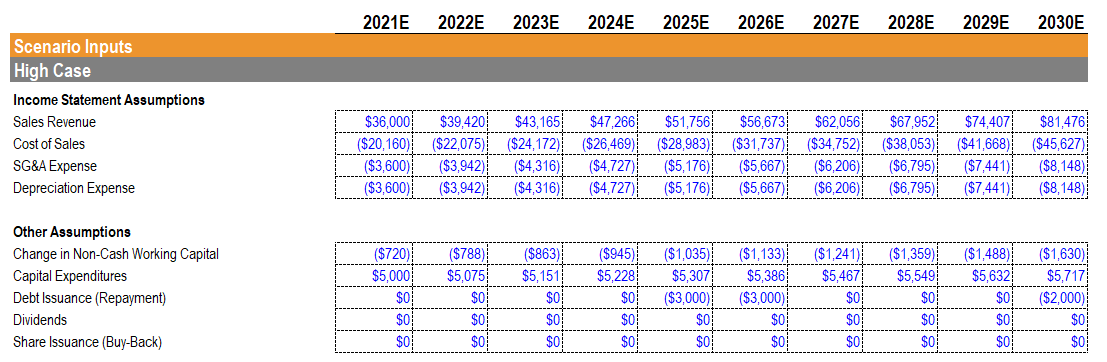
Model Inputs and Assumptions Al Figures in US sood's unless otherwise stated Model Inputs and Assumptions General Assumptions Forecast Scenario Transaction Date Fiscal Year-End Days Per Year 2021-08-01 2021-12-31 365 Current Capitalization Cash-on-Hand PP&E Total Debt Total Equity $5,000 $60,000 $35,000 $100,000 Valuation Assumptions Tax Rate Perpetual Growth Rate EBITDA Exit Multiple 28% 2% 8.5x Risk-Free Rate Equity Risk Premium Interest Rate 3% 5% 4% Investment Amount $105,000 Valuation Analysis AV Figures in UStoo's unless otherwise staled. 20215 2022E 2023E 2024E 2025E 2026E 2027E 2028E 2029 2030E Income Statement Sales Revenue Cost of Sales Gross Profit $ $0 $0 sp $ sa $o $0 $0 $0 $o $0 $0 SGRA Expense Depreciation Expense Interest Expense Income Berore income Taces Income Taxes Net Income SO SO SO $0 $0 SO SO SO SO SO $0 SO $0 $0 $0 $0 $0 $0 $0 SO Balance Sheet Items PPSE Schedule PPRE, Opening Delance Capital Expenditures Depreciation Expms PPRE, Endng Balance $0 $0 SO SO $0 $0 $0 $0 $0 $0 Debt Schedule Total Debt Opening balance Issuance (Repayment) Total DeDL Ending Balance Interest Expense $0 $0 SU $0 $0 SD $0 $o so $0 Equity Schedule Total Equity, Opening Balance Net Income Dividends Share Issuance (Buy Back) Total Equity, Ending Balance $o $o $0 $0 $0 So $0 $ $0 $o SO $0 Weighted Average Cost of Capital (WACC) All Figures in US$000's unless otherwise stated. Comparable Companies Beta Company Company A Company B Company C Company D Company E Median Levered Beta 1.45 0.92 1.26 1.03 0.88 Debt $567 $634 $321 $437 $539 Equity Debt / Equity $1,265 $914 $1,298 $1,021 $1,388 Tax Rate nlevered Beta 36% 29% 30% 32% 31% Comparable Company Analysis All Figures in US$000's unless otherwise stated. Comparable Trading Metrics Company Name EV EV/Sales Valuation (2021E) EVIEBITDA [x] PIE Company A Company B Company C Company D Company E Median Market Data Price Market Cap Net Debt [$/sh.] ($1 [$] $1 $58.23 $168,041 ($2,719) $71.54 $123,883 ($7,920) $66.21 $10,326 $5,301 $45.68 $11,618 $5,385 $26.78 $964 $42 $165,322 $115,963 $15,627 $17,003 $1,006 Financial Data (2021E) Sales EBITDA Earnings is] [$] ($1 $58,887 $16,523 $7,381 $56,415 $11,324 $5,618 $4,569 $1,515 $520 $5,512 $1,725 $487 $386 $97 $41 Precedent Transactions Analysis All Figures in US$000's unless otherwise stated. Comparable Trading Metrics Company Name Financial Data EBITDA Earnings TS1 ($ Transaction Multiples EBITDA Earnings [x] [x Transaction 1 Transaction 2 Transaction 3 Transaction 4 Transaction 5 Median Transaction Net Value Debt $1 $1 $150,000 $15,669 $200,000 $35,263 $80,000 $11,247 $110,000 $14,884 $96,000 $5,623 $17,654 $15,345 $6,589 $11,256 $9,932 $8,231 $7,917 $3,567 $5,623 $5,188 Forecast Scenarios Al Figures in US$000's unless otherwise stated. 2021E 2022E 2023E 2024E 2025E 2026E 2027E 2028E 2029E 2030E Live Case Income Statement Assumptions Sales Revenue Cost of Sales SG&A Expense Depreciation Expense Other Assumptions Change in Non-Cash Working Capital Capital Expenditures Debt Issuance (Repayment) Dividends Share Issuance (Buy-Back) 2021E 2022E 2023E 2024E 2025E 2026E 2027E 2028E 2029E 2030E Scenario Inputs Base Case Income Statement Assumptions Sales Revenue Cost of Sales SG&A Expense Depreciation Expense $36,000 ($21,600) ($5,400) ($3,600) $38,160 ($22,896) ($5,724) ($3,816) $40,450 ($24,270) ($6,067) ($4,045) $42,877 ($25,726) ($6,431) ($4,288) $45,449 ($27,270) ($6,817) ($4,545) $48,176 ($28,906) ($7,226) ($4,818) $51,067 ($30,640) ($7,660) ($5,107) $54,131 ($32,478) ($8,120) ($5,413) $57,379 ($34,427) ($8,607) ($5,738) $60,821 ($36,493) ($9,123) ($6,082) ($964). ($1,083) ($858) $5.228 ($1,148) $5,632 Other Assumptions Change in Non-Cash Working Capital Capital Expenditures Debt Issuance (Repayment) Dividends Share Issuance (Buy-Back) ($809) $5,151 $0 $5,549 ($720) $5,000 $0 $0 $0 ($763) $5,075 $0 $0 $0 ($909) $5,307 ($3,000) $0 $0 $0 $0 $0 $0 ($1,021) $5,467 $0 $0 $0 $5,386 ($3,000) $0 $0 $0 $0 ($1,216) $5,717 ($2,000) $0 $0 $0 $0 $0 $0 $0 2021E 2022E 2023E 2024E 2025E 2026E 2027E 2028E 2029E 2030E Scenario Inputs Low Case ------------ Income Statement Assumptions Sales Revenue Cost of Sales SG&A Expense Depreciation Expense $36.000 ($24,480) ($7,200) ($3,600)! $36.900 ($25,092) ($7,380) ($3,690) $37,823 ($25,719) ($7,565) ($3.782) $38.768! ----------- ($26,362) ($7,754) ($3,877) $39,737 ($27,021) ($7,947) ($3,974) $40,731 ($27,697) ($8,146) ($4,073) $41,749 ($28,389) ($8,350) ($4,175) $42.793 ------------- ($29,099) ($8,559) ($4,279) $43.863 ($29.827) ($8,773) ($4,386) $44,959 ($30,572) ($8.992) ($4.496) ($720) ($756) $5,1511 ---------- ($738) $5,075 $0 ($835) $5,467 $5,000 Other Assumptions Change in Non-Cash Working Capital Capital Expenditures Debt Issuance (Repayment) Dividends Share Issuance (Buy-Back) ($775) $5,228 $0 ($815) $5,386 ($3,000) $0 ($856) $5,549 $0 ------- ($795) $5,307 ($3.000) $0 $0 ($899) $5,717 ($2,000) ----------- $0 $0 ($877) $5,632 $0 $0 $0 $0 $0 $0 ------------- ---- $0 $0 $0 $0 $0 $0 $0 $0 ----- $0 $0 $0 $0 $0 2021E 2022E 2023E 2024E 2025E 2026E 2027E 2028E 2029E 2030E Scenario Inputs High Case Income Statement Assumptions Sales Revenue Cost of Sales SG&A Expense Depreciation Expense $36,000 ($20,160) ($3,600) ($3,600) $39,420 ($22,075) ($3,942) ($3,942) $43,165 ($24,172) ($4,316) ($4,316) $47,266 ($26,469) ($4,727) ($4,727) $51,756 ($28,983) ($5,176) ($5,176) $56,673 ($31,737) ($5,667) ($5,667) $62,056 ($34,752) ($6,206) ($6,206) $67,952 ($38,053) ($6,795) ($6,795) $74,407 ($41,668) ($7,441) $81,476 ($45,627) ($8,148) ($8,148) ($7,441) Other Assumptions Change in Non-Cash Working Capital Capital Expenditures Debt Issuance (Repayment) Dividends Share Issuance (Buy-Back) ($720) $5,000 $0 ($788 $5,075 $0 $0 $0 ($863) $5,151 $0 $0 ($945) $5,228 $0 $0 $0 ($1,035) $5,307 ($3,000) $0 $0 ($1,133) $5,386 ($3,000) $0 $0 ($1,241) $5,467 $0 $0 ($1,359) $5,549 $0 $0 $0 ($1,488) $5,632 $0 $0 $0 ($1,630) $5,717 ($2,000) $0 $0 $0 $0 $0 $0 Model Inputs and Assumptions Al Figures in US sood's unless otherwise stated Model Inputs and Assumptions General Assumptions Forecast Scenario Transaction Date Fiscal Year-End Days Per Year 2021-08-01 2021-12-31 365 Current Capitalization Cash-on-Hand PP&E Total Debt Total Equity $5,000 $60,000 $35,000 $100,000 Valuation Assumptions Tax Rate Perpetual Growth Rate EBITDA Exit Multiple 28% 2% 8.5x Risk-Free Rate Equity Risk Premium Interest Rate 3% 5% 4% Investment Amount $105,000 Valuation Analysis AV Figures in UStoo's unless otherwise staled. 20215 2022E 2023E 2024E 2025E 2026E 2027E 2028E 2029 2030E Income Statement Sales Revenue Cost of Sales Gross Profit $ $0 $0 sp $ sa $o $0 $0 $0 $o $0 $0 SGRA Expense Depreciation Expense Interest Expense Income Berore income Taces Income Taxes Net Income SO SO SO $0 $0 SO SO SO SO SO $0 SO $0 $0 $0 $0 $0 $0 $0 SO Balance Sheet Items PPSE Schedule PPRE, Opening Delance Capital Expenditures Depreciation Expms PPRE, Endng Balance $0 $0 SO SO $0 $0 $0 $0 $0 $0 Debt Schedule Total Debt Opening balance Issuance (Repayment) Total DeDL Ending Balance Interest Expense $0 $0 SU $0 $0 SD $0 $o so $0 Equity Schedule Total Equity, Opening Balance Net Income Dividends Share Issuance (Buy Back) Total Equity, Ending Balance $o $o $0 $0 $0 So $0 $ $0 $o SO $0 Weighted Average Cost of Capital (WACC) All Figures in US$000's unless otherwise stated. Comparable Companies Beta Company Company A Company B Company C Company D Company E Median Levered Beta 1.45 0.92 1.26 1.03 0.88 Debt $567 $634 $321 $437 $539 Equity Debt / Equity $1,265 $914 $1,298 $1,021 $1,388 Tax Rate nlevered Beta 36% 29% 30% 32% 31% Comparable Company Analysis All Figures in US$000's unless otherwise stated. Comparable Trading Metrics Company Name EV EV/Sales Valuation (2021E) EVIEBITDA [x] PIE Company A Company B Company C Company D Company E Median Market Data Price Market Cap Net Debt [$/sh.] ($1 [$] $1 $58.23 $168,041 ($2,719) $71.54 $123,883 ($7,920) $66.21 $10,326 $5,301 $45.68 $11,618 $5,385 $26.78 $964 $42 $165,322 $115,963 $15,627 $17,003 $1,006 Financial Data (2021E) Sales EBITDA Earnings is] [$] ($1 $58,887 $16,523 $7,381 $56,415 $11,324 $5,618 $4,569 $1,515 $520 $5,512 $1,725 $487 $386 $97 $41 Precedent Transactions Analysis All Figures in US$000's unless otherwise stated. Comparable Trading Metrics Company Name Financial Data EBITDA Earnings TS1 ($ Transaction Multiples EBITDA Earnings [x] [x Transaction 1 Transaction 2 Transaction 3 Transaction 4 Transaction 5 Median Transaction Net Value Debt $1 $1 $150,000 $15,669 $200,000 $35,263 $80,000 $11,247 $110,000 $14,884 $96,000 $5,623 $17,654 $15,345 $6,589 $11,256 $9,932 $8,231 $7,917 $3,567 $5,623 $5,188 Forecast Scenarios Al Figures in US$000's unless otherwise stated. 2021E 2022E 2023E 2024E 2025E 2026E 2027E 2028E 2029E 2030E Live Case Income Statement Assumptions Sales Revenue Cost of Sales SG&A Expense Depreciation Expense Other Assumptions Change in Non-Cash Working Capital Capital Expenditures Debt Issuance (Repayment) Dividends Share Issuance (Buy-Back) 2021E 2022E 2023E 2024E 2025E 2026E 2027E 2028E 2029E 2030E Scenario Inputs Base Case Income Statement Assumptions Sales Revenue Cost of Sales SG&A Expense Depreciation Expense $36,000 ($21,600) ($5,400) ($3,600) $38,160 ($22,896) ($5,724) ($3,816) $40,450 ($24,270) ($6,067) ($4,045) $42,877 ($25,726) ($6,431) ($4,288) $45,449 ($27,270) ($6,817) ($4,545) $48,176 ($28,906) ($7,226) ($4,818) $51,067 ($30,640) ($7,660) ($5,107) $54,131 ($32,478) ($8,120) ($5,413) $57,379 ($34,427) ($8,607) ($5,738) $60,821 ($36,493) ($9,123) ($6,082) ($964). ($1,083) ($858) $5.228 ($1,148) $5,632 Other Assumptions Change in Non-Cash Working Capital Capital Expenditures Debt Issuance (Repayment) Dividends Share Issuance (Buy-Back) ($809) $5,151 $0 $5,549 ($720) $5,000 $0 $0 $0 ($763) $5,075 $0 $0 $0 ($909) $5,307 ($3,000) $0 $0 $0 $0 $0 $0 ($1,021) $5,467 $0 $0 $0 $5,386 ($3,000) $0 $0 $0 $0 ($1,216) $5,717 ($2,000) $0 $0 $0 $0 $0 $0 $0 2021E 2022E 2023E 2024E 2025E 2026E 2027E 2028E 2029E 2030E Scenario Inputs Low Case ------------ Income Statement Assumptions Sales Revenue Cost of Sales SG&A Expense Depreciation Expense $36.000 ($24,480) ($7,200) ($3,600)! $36.900 ($25,092) ($7,380) ($3,690) $37,823 ($25,719) ($7,565) ($3.782) $38.768! ----------- ($26,362) ($7,754) ($3,877) $39,737 ($27,021) ($7,947) ($3,974) $40,731 ($27,697) ($8,146) ($4,073) $41,749 ($28,389) ($8,350) ($4,175) $42.793 ------------- ($29,099) ($8,559) ($4,279) $43.863 ($29.827) ($8,773) ($4,386) $44,959 ($30,572) ($8.992) ($4.496) ($720) ($756) $5,1511 ---------- ($738) $5,075 $0 ($835) $5,467 $5,000 Other Assumptions Change in Non-Cash Working Capital Capital Expenditures Debt Issuance (Repayment) Dividends Share Issuance (Buy-Back) ($775) $5,228 $0 ($815) $5,386 ($3,000) $0 ($856) $5,549 $0 ------- ($795) $5,307 ($3.000) $0 $0 ($899) $5,717 ($2,000) ----------- $0 $0 ($877) $5,632 $0 $0 $0 $0 $0 $0 ------------- ---- $0 $0 $0 $0 $0 $0 $0 $0 ----- $0 $0 $0 $0 $0 2021E 2022E 2023E 2024E 2025E 2026E 2027E 2028E 2029E 2030E Scenario Inputs High Case Income Statement Assumptions Sales Revenue Cost of Sales SG&A Expense Depreciation Expense $36,000 ($20,160) ($3,600) ($3,600) $39,420 ($22,075) ($3,942) ($3,942) $43,165 ($24,172) ($4,316) ($4,316) $47,266 ($26,469) ($4,727) ($4,727) $51,756 ($28,983) ($5,176) ($5,176) $56,673 ($31,737) ($5,667) ($5,667) $62,056 ($34,752) ($6,206) ($6,206) $67,952 ($38,053) ($6,795) ($6,795) $74,407 ($41,668) ($7,441) $81,476 ($45,627) ($8,148) ($8,148) ($7,441) Other Assumptions Change in Non-Cash Working Capital Capital Expenditures Debt Issuance (Repayment) Dividends Share Issuance (Buy-Back) ($720) $5,000 $0 ($788 $5,075 $0 $0 $0 ($863) $5,151 $0 $0 ($945) $5,228 $0 $0 $0 ($1,035) $5,307 ($3,000) $0 $0 ($1,133) $5,386 ($3,000) $0 $0 ($1,241) $5,467 $0 $0 ($1,359) $5,549 $0 $0 $0 ($1,488) $5,632 $0 $0 $0 ($1,630) $5,717 ($2,000) $0 $0 $0 $0 $0 $0