

Answered step by step
Verified Expert Solution
Question
1 Approved Answer
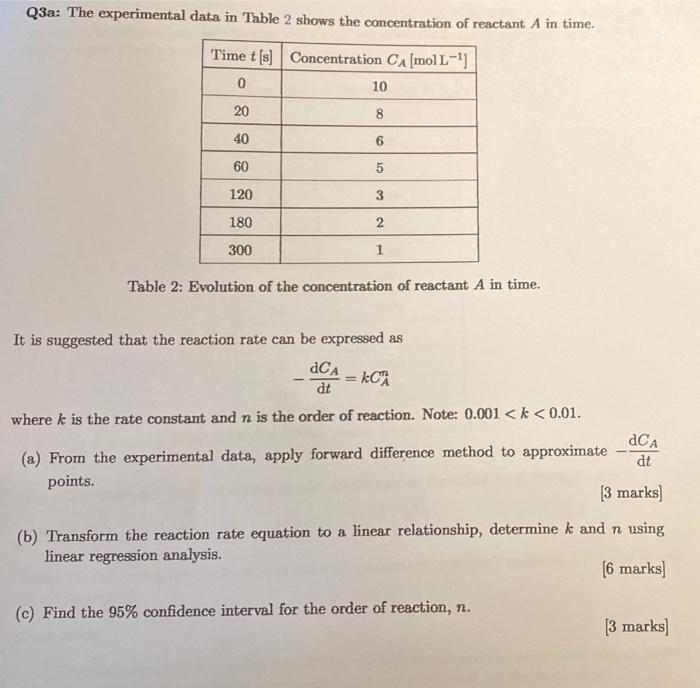
Q3a: The experimental data in Table 2 shows the concentration of reactant A in time. Time t [s] Concentration CA mol L-') 10 0 20
Step by Step Solution
There are 3 Steps involved in it
Step: 1

Get Instant Access to Expert-Tailored Solutions
See step-by-step solutions with expert insights and AI powered tools for academic success
Step: 2

Step: 3
Ace Your Homework with AI
Get the answers you need in no time with our AI-driven, step-by-step assistance
Get Started
Elementary Principles of Chemical Processes
Authors: Richard M. Felder, Ronald W. Rousseau
3rd Edition
978-0471687573, 9788126515820, 978-0-471-4152, 0471720631, 047168757X, 8126515821, 978-0471720638