

Answered step by step
Verified Expert Solution
Question
1 Approved Answer
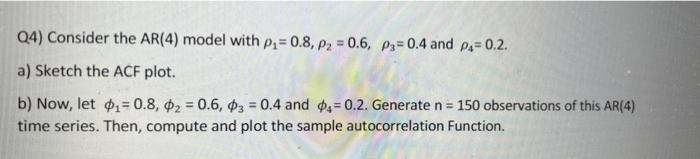
Q4) Consider the AR(4) model with p, = 0.8, p2 = 0.6, p;= 0.4 and p.= 0.2. a) Sketch the ACF plot. b) Now, let

Step by Step Solution
There are 3 Steps involved in it
Step: 1

Get Instant Access to Expert-Tailored Solutions
See step-by-step solutions with expert insights and AI powered tools for academic success
Step: 2

Step: 3
Ace Your Homework with AI
Get the answers you need in no time with our AI-driven, step-by-step assistance
Get Started
Elementary Algebra Graphs And Authentic Applications
Authors: Jay Lehmann
2nd Edition
0321923472, 9780321923479