Answered step by step
Verified Expert Solution
Question
1 Approved Answer
Q4. Johnny's Burger is a family-run fast food joint. In addition to its famous hamburger, Johnny's Burger has just launched a new Organic Beef
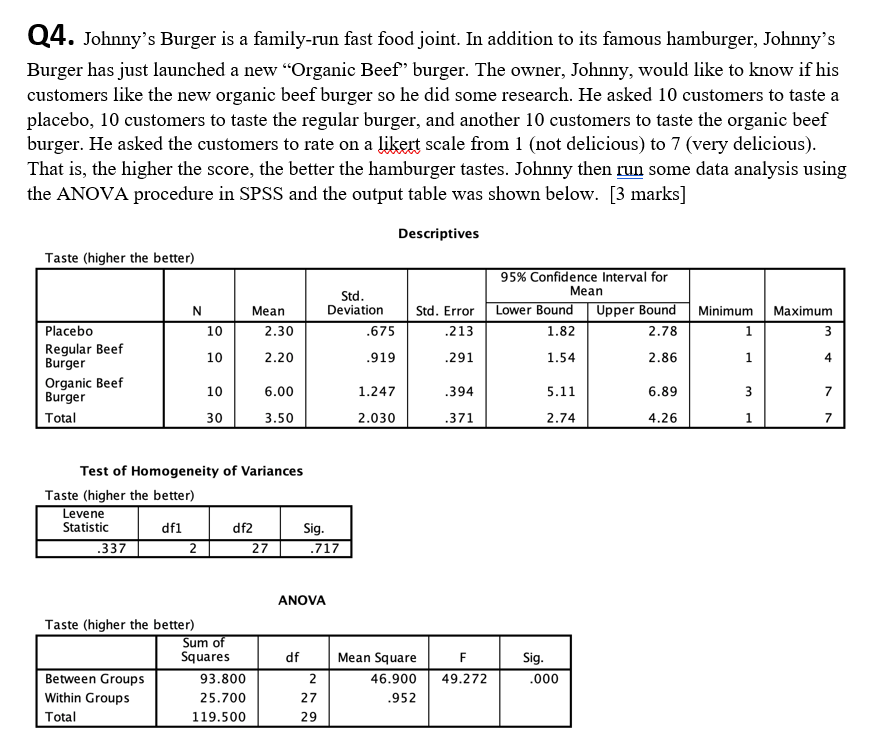
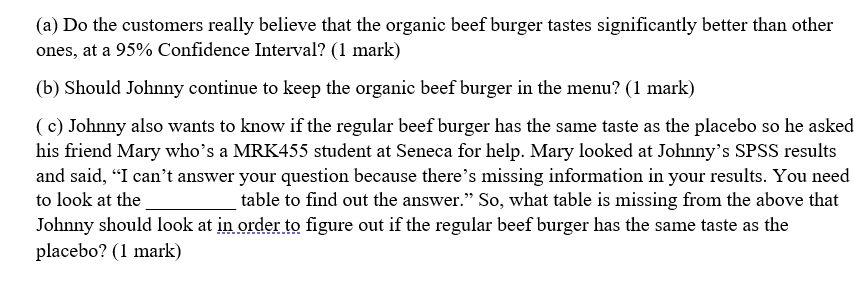
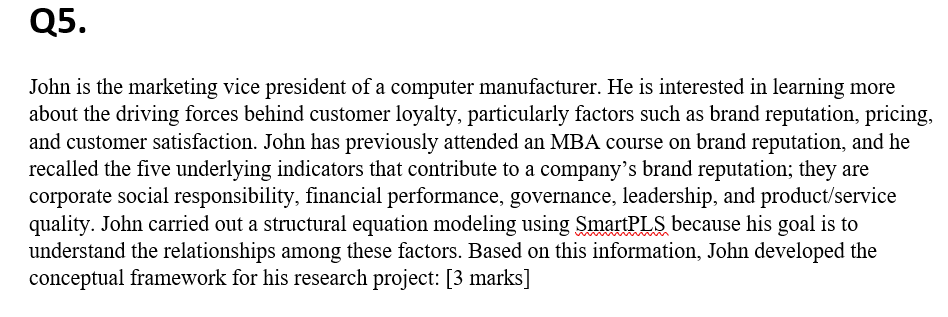
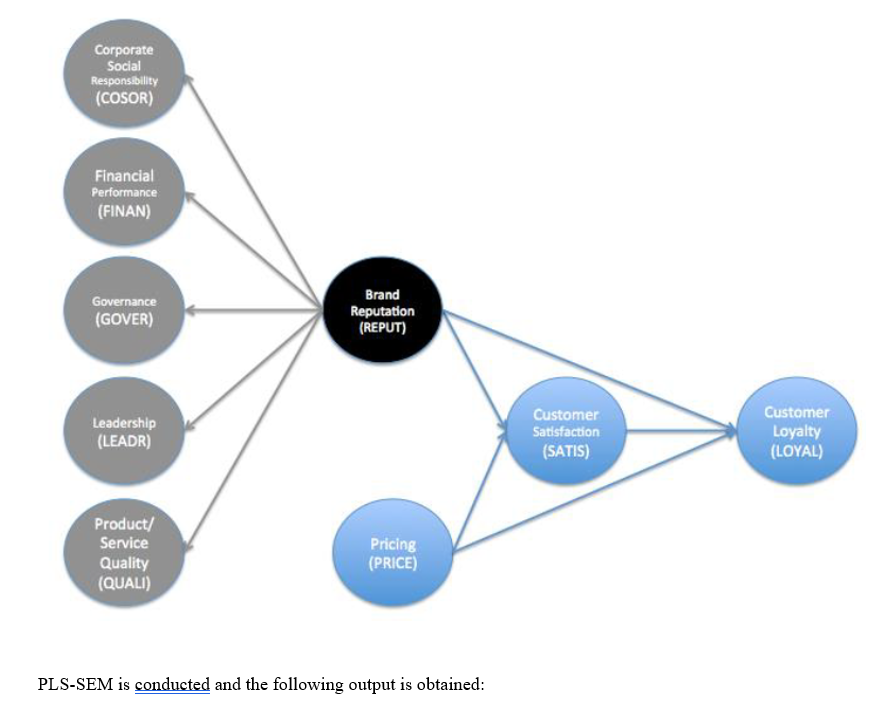
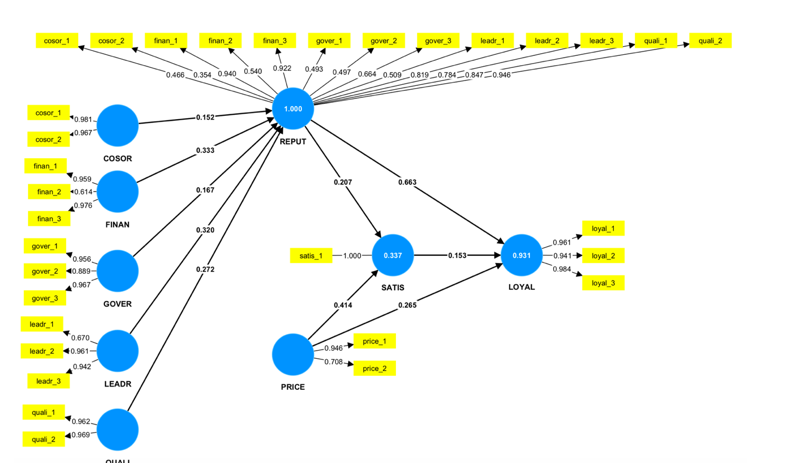
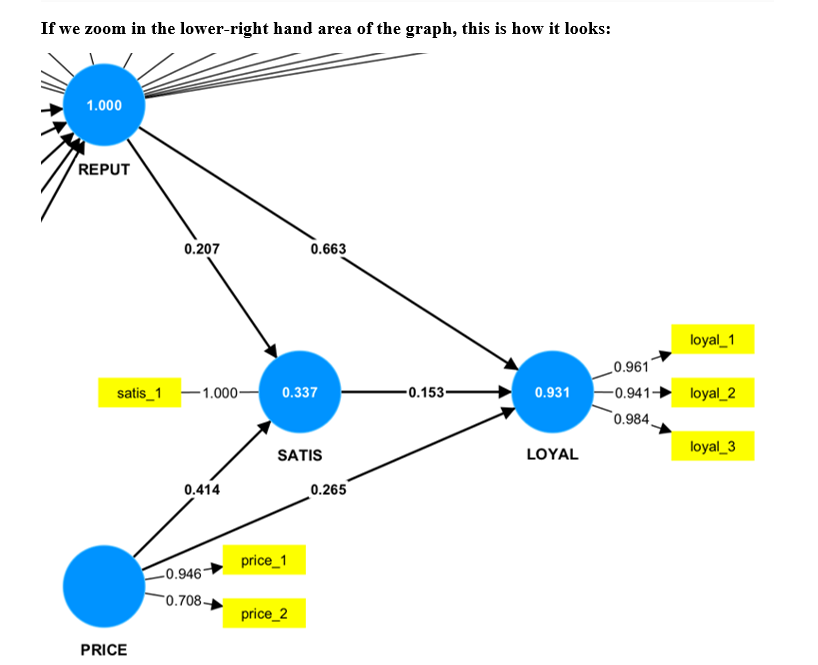
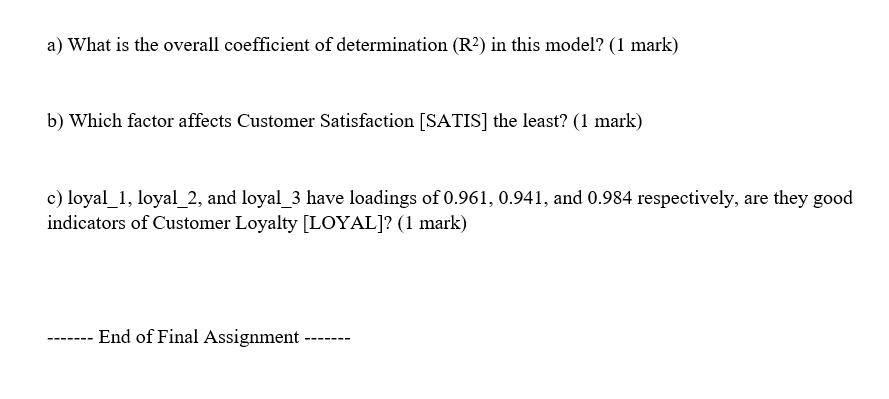
Q4. Johnny's Burger is a family-run fast food joint. In addition to its famous hamburger, Johnny's Burger has just launched a new "Organic Beef burger. The owner, Johnny, would like to know if his customers like the new organic beef burger so he did some research. He asked 10 customers to taste a placebo, 10 customers to taste the regular burger, and another 10 customers to taste the organic beef burger. He asked the customers to rate on a likert scale from 1 (not delicious) to 7 (very delicious). That is, the higher the score, the better the hamburger tastes. Johnny then run some data analysis using the ANOVA procedure in SPSS and the output table was shown below. [3 marks] Taste (higher the better) Descriptives Std. 95% Confidence Interval for Mean N Mean Deviation Std. Error Lower Bound Upper Bound Minimum Maximum Placebo 10 2.30 .675 .213 1.82 2.78 1 3 Regular Beef 10 2.20 Burger .919 .291 1.54 2.86 1 4 Organic Beef 10 6.00 1.247 .394 5.11 6.89 3 7 Burger Total 30 3.50 2.030 .371 2.74 4.26 1 7 Test of Homogeneity of Variances Taste (higher the better) Levene Statistic df1 df2 .337 2 27 Sig. .717 Taste (higher the better) ANOVA Sum of Squares df Mean Square Between Groups 93.800 2 Within Groups 25.700 27 46.900 .952 F 49.272 Sig. .000 Total 119.500 29 (a) Do the customers really believe that the organic beef burger tastes significantly better than other ones, at a 95% Confidence Interval? (1 mark) (b) Should Johnny continue to keep the organic beef burger in the menu? (1 mark) (c) Johnny also wants to know if the regular beef burger has the same taste as the placebo so he asked his friend Mary who's a MRK455 student at Seneca for help. Mary looked at Johnny's SPSS results and said, "I can't answer your question because there's missing information in your results. You need to look at the table to find out the answer." So, what table is missing from the above that Johnny should look at in order to figure out if the regular beef burger has the same taste as the placebo? (1 mark) Q5. John is the marketing vice president of a computer manufacturer. He is interested in learning more about the driving forces behind customer loyalty, particularly factors such as brand reputation, pricing, and customer satisfaction. John has previously attended an MBA course on brand reputation, and he recalled the five underlying indicators that contribute to a company's brand reputation; they are corporate social responsibility, financial performance, governance, leadership, and product/service quality. John carried out a structural equation modeling using SmartPLS because his goal is to understand the relationships among these factors. Based on this information, John developed the conceptual framework for his research project: [3 marks] Corporate Social Responsibility (COSOR) Financial Performance (FINAN) Governance (GOVER) Brand Reputation (REPUT) Leadership (LEADR) Product/ Service Pricing Quality (PRICE) (QUALI) PLS-SEM is conducted and the following output is obtained: Customer Satisfaction Customer (SATIS) Loyalty (LOYAL) cosor 1 cosor 2 finan 1 finan_2 finan 3 gover 1 gover 2 gover 3 leadr 1 leadr_2 leadr 3 qual 1 quali 2 cosor 1 0.466 0.354 0.940 0.540 0.922 0.493 0.497 0.664 0.509 0.819 0.7840847 0.946 1.000 0.981- 0.967 -0.152 cosor 2 REPUT 0.333 COSOR finan_1 0.959 finan 2 0.614- finan 3 0.167 0.976 FINAN 0.320 gover 1 0.956 gover 240.889- 0.967 gover 3 GOVER leadr_1 0.670 leadr 2 0.961- 0.207 0.663 loyal 1 0.961 satis 1 -1.000- 0.337 -0.153- 0.931 0.272 -0.941- loyal_2 0.984 loyal 3 SATIS 0.414 0.265 LOYAL 0.942 leadr 3 LEADR PRICE quali 1 quali 2 0.962 0.969- QUALL price 1 0.946 0.708- price 2 If we zoom in the lower-right hand area of the graph, this is how it looks: 1.000 REPUT 0.207 0.663 loyal_1 0.961 satis 1 1.000- 0.337 0.153 0.931 -0.941 loyal_2 0.984 LOYAL loyal_3 PRICE SATIS 0.414 0.265 price_1 -0.946 0.708- price_2 a) What is the overall coefficient of determination (R2) in this model? (1 mark) b) Which factor affects Customer Satisfaction [SATIS] the least? (1 mark) c) loyal_1, loyal_2, and loyal_3 have loadings of 0.961, 0.941, and 0.984 respectively, are they good indicators of Customer Loyalty [LOYAL]? (1 mark) End of Final Assignment ------
Step by Step Solution
There are 3 Steps involved in it
Step: 1
QUESTION 4 a To determine if customers believe the organic beef burger tastes significantly better than other options at a 95 confidence interval we n...
Get Instant Access to Expert-Tailored Solutions
See step-by-step solutions with expert insights and AI powered tools for academic success
Step: 2

Step: 3

Ace Your Homework with AI
Get the answers you need in no time with our AI-driven, step-by-step assistance
Get Started


