

Answered step by step
Verified Expert Solution
Question
1 Approved Answer
Q4. The following figures show the price movements, volume and open interest, and Relative Strength Index for Sep 2018 Coffee futures contract during the last
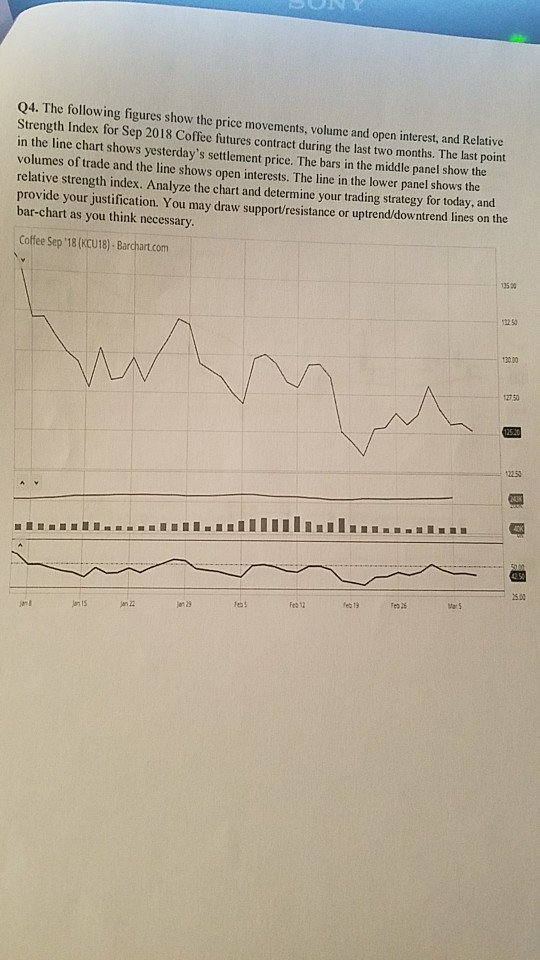
Q4. The following figures show the price movements, volume and open interest, and Relative Strength Index for Sep 2018 Coffee futures contract during the last two months. The last point in the line chart shows yesterday's settlement price. The bars in the middle panel show the volumes of trade and the line shows open interests. The line in the lower panel shows the relative strength index. Analyze the chart and determine your trading strategy for today. and provide your justification. You may draw support/resistance or uptrend/downtrend lines on the bar-chart as you think necessary. Coffee Sep 18 (KCU18) Barchart.com 35 12 5 20 00 27 50 2250 500 feas Fr 12
Step by Step Solution
There are 3 Steps involved in it
Step: 1

Get Instant Access to Expert-Tailored Solutions
See step-by-step solutions with expert insights and AI powered tools for academic success
Step: 2

Step: 3
Ace Your Homework with AI
Get the answers you need in no time with our AI-driven, step-by-step assistance
Get Started
Consolidation In The European Financial Industry
Authors: R. Bottiglia, E. Gualandri , G. Mazzocco
1st Edition
0230233228,0230275028