

Answered step by step
Verified Expert Solution
Question
1 Approved Answer
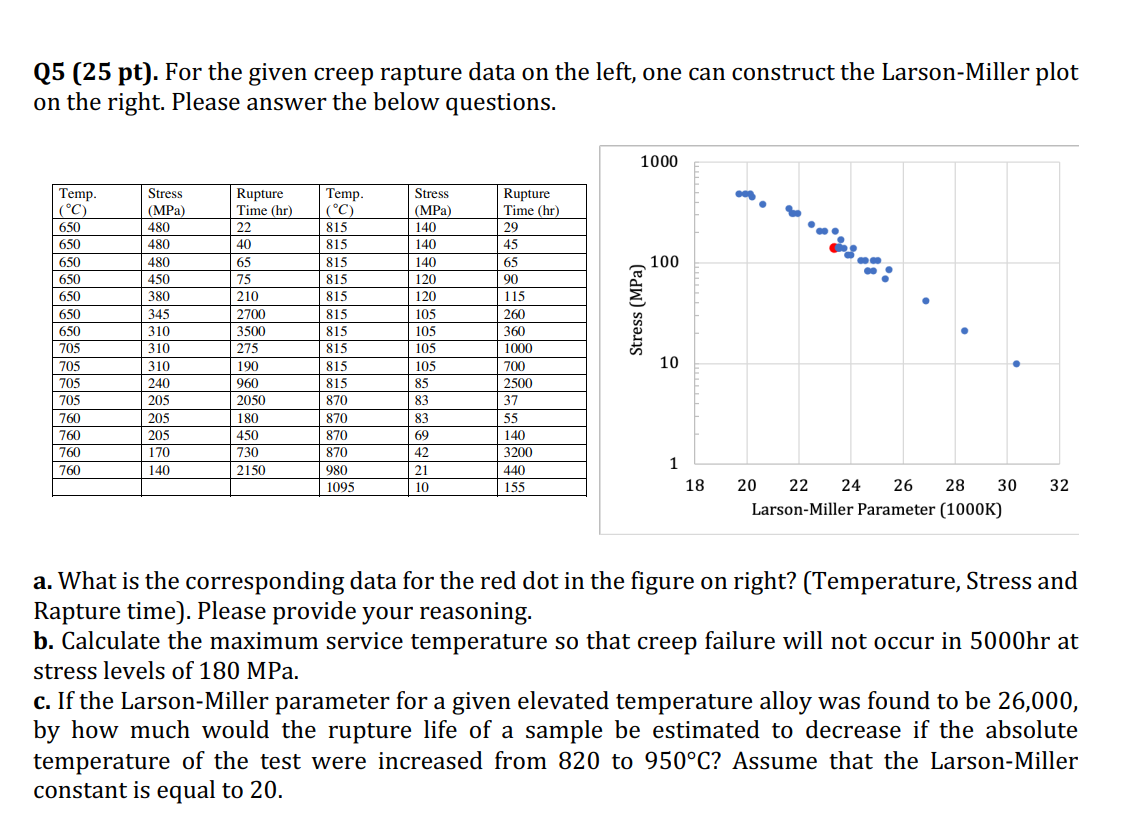
Q5 (25 pt). For the given creep rapture data on the left, one can construct the Larson-Miller plot on the right. Please answer the below
Step by Step Solution
There are 3 Steps involved in it
Step: 1

Get Instant Access to Expert-Tailored Solutions
See step-by-step solutions with expert insights and AI powered tools for academic success
Step: 2

Step: 3
Ace Your Homework with AI
Get the answers you need in no time with our AI-driven, step-by-step assistance
Get Started
Introduction To Chemical Engineering Thermodynamics
Authors: J.M. Smith, Hendrick Van Ness, Michael Abbott, Mark Swihart
8th Edition
1259696529, 978-1259696527