Answered step by step
Verified Expert Solution
Question
1 Approved Answer
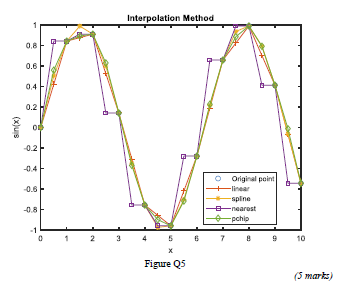
Q5 Figure Q5 shows a figure generated from the following incomplete code. Complete the code y=sin(x); x1=0:0.5:10; plot(x,y,'o',x1,xlinear,'-+',x1,xspline,'-*',x1,xnearest,'- s',x1,xpchip,'-'); xlabel('x') ylabel('sin(x)') title('Interpolation Method) Interpolation Method
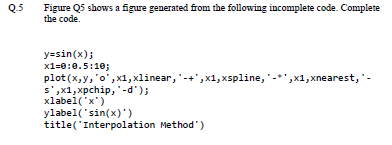
Q5 Figure Q5 shows a figure generated from the following incomplete code. Complete the code y=sin(x); x1=0:0.5:10; plot(x,y,'o',x1,xlinear,'-+',x1,xspline,'-*',x1,xnearest,'- s',x1,xpchip,'-'); xlabel('x') ylabel('sin(x)') title('Interpolation Method) Interpolation Method 1 0.8 0.6 0.4 0.2 sin(x) On -0.2 0 Original point -0.6 -0.8 -spine nearest pchip -1 0 2 TO Figure Q5 (5 marts) Q5 Figure Q5 shows a figure generated from the following incomplete code. Complete the code y=sin(x); x1=0:0.5:10; plot(x,y,'o',x1,xlinear,'-+',x1,xspline,'-*',x1,xnearest,'- s',x1,xpchip,'-'); xlabel('x') ylabel('sin(x)') title('Interpolation Method) Interpolation Method 1 0.8 0.6 0.4 0.2 sin(x) On -0.2 0 Original point -0.6 -0.8 -spine nearest pchip -1 0 2 TO Figure Q5 (5 marts)
Step by Step Solution
There are 3 Steps involved in it
Step: 1
Get Instant Access to Expert-Tailored Solutions
See step-by-step solutions with expert insights and AI powered tools for academic success
Step: 2
Step: 3
Ace Your Homework with AI
Get the answers you need in no time with our AI-driven, step-by-step assistance
Get Started