

Answered step by step
Verified Expert Solution
Question
1 Approved Answer
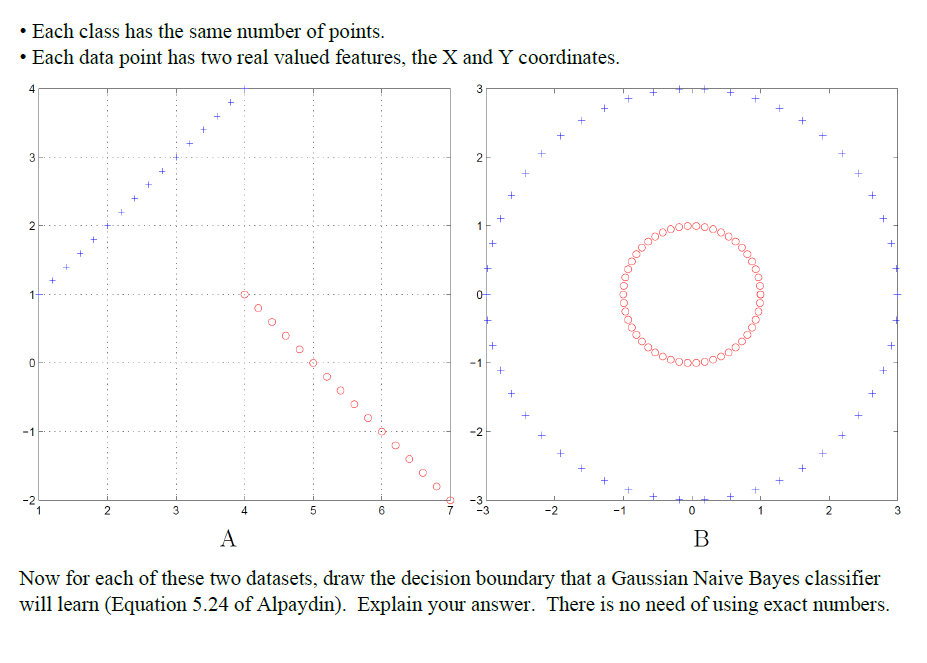
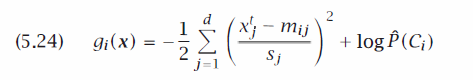
Q6 [12 pt] Consider the two datasets shown in plots (A) and (B) below: In each of these datasets there are two classes. +' and

Step by Step Solution
There are 3 Steps involved in it
Step: 1

Get Instant Access to Expert-Tailored Solutions
See step-by-step solutions with expert insights and AI powered tools for academic success
Step: 2

Step: 3
Ace Your Homework with AI
Get the answers you need in no time with our AI-driven, step-by-step assistance
Get Started
Linear Algebra A Modern Introduction
Authors: David Poole
3rd edition
9781133169574 , 978-0538735452