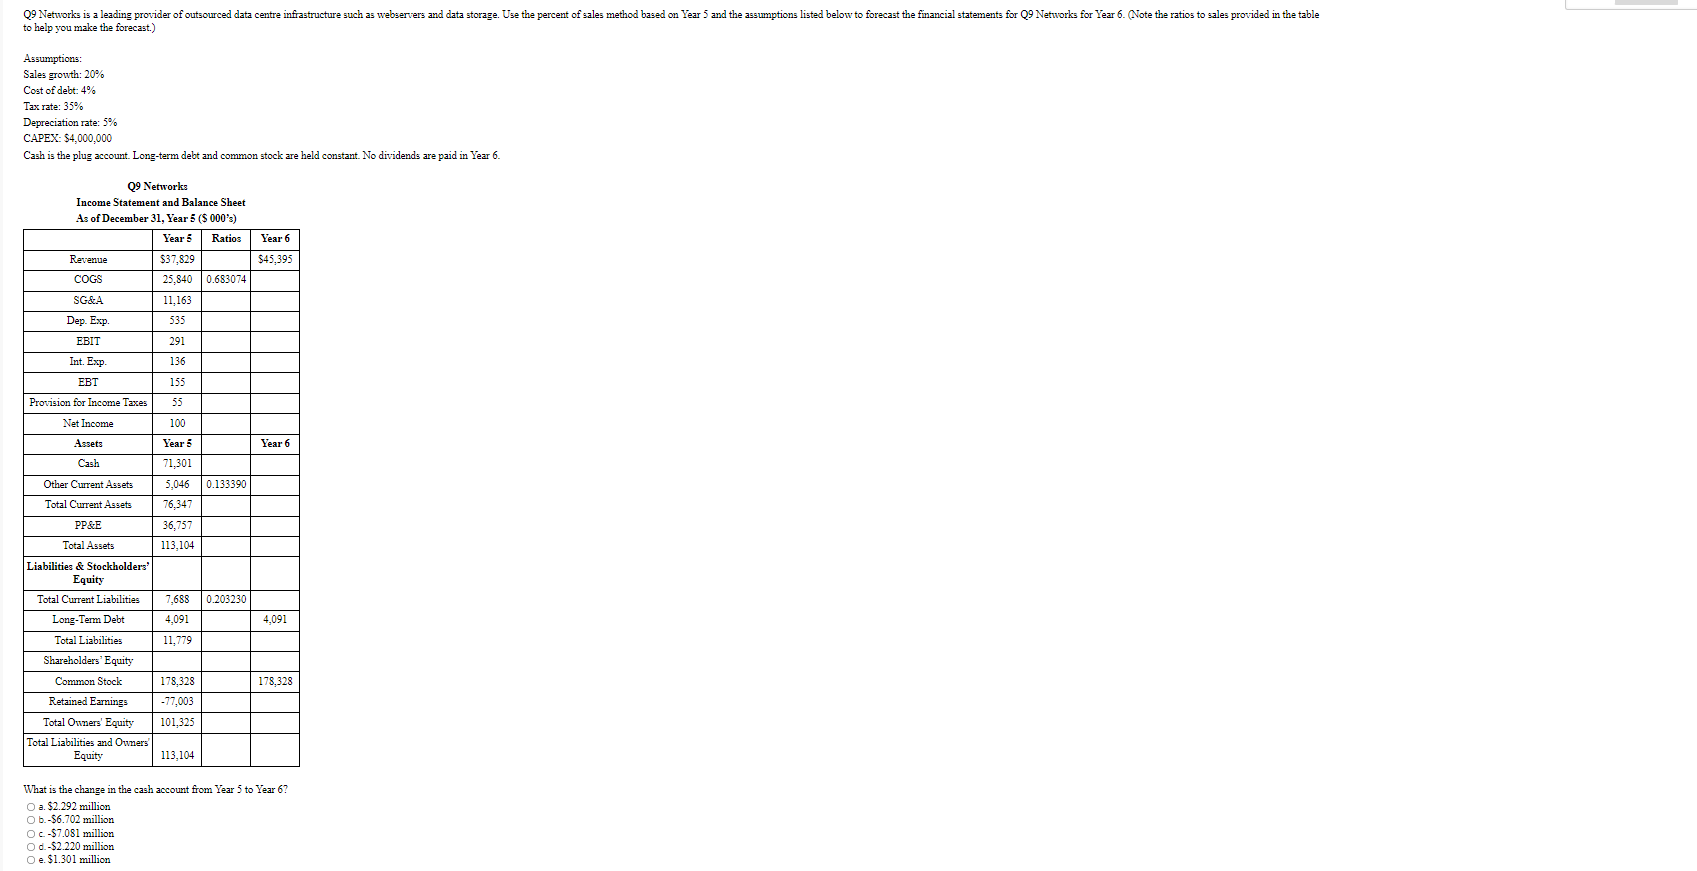
Q9 Networks is a leading provider of outsourced data centre infrastructure such as webservers and data storage. Use the percent of sales method based on Year 5 and the assumptions listed below to forecast the financial statements for Q9 Networks for Year 6. (Note the ratios to sales provided in the table to help you make the forecast.)
Assumptions:
Sales growth: 20%
Cost of debt: 4%
Tax rate: 35%
Depreciation rate: 5%
CAPEX: $4,000,000
Cash is the plug account. Long-term debt and common stock are held constant. No dividends are paid in Year 6.
09 Networks is a leading provider of outsourced data centre infrastructure such as webservers and data storage. Use the percent of sales method based on Year 5 and the assumptions listed below to forecast the financial statements for Q9 Networks for Year 6. Note the ratios to sales provided in the table to help you make the forecast.) Assumptions: Sales growth: 20% Cost of debt: 4% Tax rate: 35% Depreciation rate: 5% CAPEX: $4,000,000 Cash is the plug account. Long-term debt and common stock are held constant. No dividends are paid in Year 6. Year 6 $45.393 09 Networks Income Statement and Balance Sheet As of December 31, Year 5 ($ 000's) Year 3 Ratios Revenue $37,829 COGS 25,840 0.683074 SG&A 11,163 Dap. Exp. 535 EBIT 291 Int. Exp. 136 155 Provision for Income Taxes 55 Net Income 100 Year 6 Assets Cash Year 5 71,301 0.133390 Other Current Assets Total Current Assets 5,046 76,347 36,757 113,104 7,688 0.203230 4,091 4,091 PP&E Total Assets Liabilities & Stockholders' Equity Total Current Liabilities Long-Term Debt Total Liabilities Shareholders' Equity Common Stock Retained Earnings Total Owners' Equity Total Liabilities and Owners Equity 11.779 178.328 178,328 -77,003 101,325 113,104 What is the change in the cash account from Year 5 to Year 6? O a $2.292 million O b.-$6.702 million OC-$7.081 million O d.-$2.220 million O e $1.301 million 09 Networks is a leading provider of outsourced data centre infrastructure such as webservers and data storage. Use the percent of sales method based on Year 5 and the assumptions listed below to forecast the financial statements for Q9 Networks for Year 6. Note the ratios to sales provided in the table to help you make the forecast.) Assumptions: Sales growth: 20% Cost of debt: 4% Tax rate: 35% Depreciation rate: 5% CAPEX: $4,000,000 Cash is the plug account. Long-term debt and common stock are held constant. No dividends are paid in Year 6. Year 6 $45.393 09 Networks Income Statement and Balance Sheet As of December 31, Year 5 ($ 000's) Year 3 Ratios Revenue $37,829 COGS 25,840 0.683074 SG&A 11,163 Dap. Exp. 535 EBIT 291 Int. Exp. 136 155 Provision for Income Taxes 55 Net Income 100 Year 6 Assets Cash Year 5 71,301 0.133390 Other Current Assets Total Current Assets 5,046 76,347 36,757 113,104 7,688 0.203230 4,091 4,091 PP&E Total Assets Liabilities & Stockholders' Equity Total Current Liabilities Long-Term Debt Total Liabilities Shareholders' Equity Common Stock Retained Earnings Total Owners' Equity Total Liabilities and Owners Equity 11.779 178.328 178,328 -77,003 101,325 113,104 What is the change in the cash account from Year 5 to Year 6? O a $2.292 million O b.-$6.702 million OC-$7.081 million O d.-$2.220 million O e $1.301 million


